Article
Spectroscopy
Spectroscopy
UV Resonance Raman Characterization of Diphenylalanine–Graphene Nanotubes
UVRR spectroscopy can be used to characterize nanotubes formed with diphenylalanine peptides and graphene by tuning the excitation wavelengths to match the electronic transitions of the individual components.
Raman spectroscopy is a sensitive method for monitoring the self-assembly of biological macromolecules. Amyloidogenic peptides have been shown to form peptide nanotubes often with a central diphenylalanine core. In this article, we show that UV resonance Raman spectroscopy (UVRR) can be used to characterize nanotubes formed with diphenylalanine (FF) peptides and graphene by tuning the excitation wavelengths to match the electronic transitions of the individual components (FF and graphene) and probe their properties during assembly. Raman spectra of graphene consist of spectral bands indicative of sp2 hybridized content. Deep UVRR spectra of graphene show a distinct "G" tangential stretching mode, which is split into a doublet at 1477 cm-1 and 1516 cm-1. Scanning electron microscopy is used to confirm formation of diphenylalanine–graphene nanotube assembly.
Molecular self-assembly has attracted considerable attention for the design and fabrication of nanostructures. Self-assembly is ubiquitous in biological systems and plays a key pathogenic role in amyloidosis, which is the underlying cause of diseases like Alzheimer's disease, type II diabetes, and prion diseases. Diphenylalanine (FF) peptides, a core structural motif of the Alzheimer's β-amyloid polypeptide, spontaneously self-assemble into nanostructures and can act as a template in the self-assembly process, facilitating the formation of both peptide nanocomposites and conductive nanowires. Reduced graphene sheets and FF dipeptides form nanocomposites through simple mixing, in which the electrostatic and aromatic properties of both species, particularly π-π stacking interactions and hydrophobicity, drive the association (1).
Graphene, a two-dimensional sheet of one-atom-layer-thick sp2-bonded carbon atoms (2), possesses unique electronic transport properties (3,4) and is also an interesting candidate for composite materials because of its mechanical flexibility (5,6), large surface area (7), thermal and chemical stability (8), and ease of functionalization of the graphene edges (5,7,9,10). Graphene is often chemically modified at the periphery to facilitate its dispersion into monolayers under aqueous conditions (11).
UV resonance Raman (UVRR) spectroscopy, a powerful and convenient tool for protein structural characterization and studying molecular self-assembly in peptides and proteins (12–16), has also been shown to be particularly useful for characterizing the properties of highly insoluble and fibril precipitations (14,17,18). Previously, visible Raman spectroscopy had been used for characterization of carbon-based materials (19–22), but recently deep UVRR spectroscopy has emerged as a convenient technique for characterizing such materials (22–24). Advantages of UVRR spectroscopy arise from the resonance-enhanced signal, which allows it to overcome the strong scattering and fluorescence effects of the sp2-bonded carbon in the visible region. The present study uses UVRR spectroscopy in combination with scanning electron microscopy (SEM) to probe the interaction of diphenylalanine with functionalized graphene nanoplatelets and their self-assembly into nanostructures.
Experimental
Peptides were purchased from Sigma-Aldrich, and stock solutions were prepared by dissolving the lyophilized powder in 1,1,1,3,3,3-hexafluoro-2-propanol (HFIP) (Sigma-Aldrich) to a concentration of 100 mg/mL. This concentrated stock was diluted into aqueous media to a final concentration of 2 mg/mL for nanotube preparation. The functionalized graphene dispersions were prepared by adding 1 mg of single-layer graphene nanoplatelets (Cheaptubes Inc.) to 7XTE buffer and sonicating for at least 2 h to uniformly disperse the graphene. 7XTE buffer contained 7 mL of Tris (TEKnova 1 M, pH 7.5) and 1.4 mL of EDTA (Promega Inc., 0.5 M, pH 8.0) in water to a final volume of 100 mL and pH of 7.4. For circular dichroism (CD) measurements, a stock 2-mg/mL peptide solution was immediately diluted to 0.04 mg/mL and spectra were recorded on a Jasco spectropolarimeter J-180 with a Peltier controller unit and a quartz cuvette with a 2-mm optical pathlength. SEM images were prepared using a JEOL JSM-6390 LV SEM system (JEOL). For SEM, an aliquot (10 μL) of the peptide nanotubes (2 mg/mL) was deposited on aluminum stubs and sputter coated with 50-Å Au-Pd. For the UVRR experiments a Nd:YLF pumped Ti:sapphire laser system (Quantronix) was used to generate the excitation wavelengths of 210 nm and 262 nm as previously described (25,26). Raman spectra at 229 nm were acquired with a continuous wave ion laser (Innova 300C MotoFreD Argon; Coherent) in which the 457.9-nm laser line was intracavity frequency-doubled with a barium borate (BBO) crystal to yield 229 nm. The lasers were operated at an average power of 1.0 mW. Raman spectra were acquired with the monochromator-CCD system previously described (25). A 170-μm spectral slit width was used for all excitation wavelengths, and data were calibrated with acetone, ethanol, and pentane and were accurate to 1 cm-1. Spectra were collected for an acquisition time of 90 s to prevent sample damage. Data manipulation and analysis were performed using GramsAI spectral analysis software (ThermoGalactic).
Results
To verify the formation of peptide-graphene nanotubes, we visualized the nanotubes using SEM and examined them relative to each species of the solution (Figure 1). Specifically, the functionalized graphene dispersion in the absence of any peptide appears as flakes in SEM (Figure 1a). FF stock dilution into 7XTE leads to the formation of a nanotube mesh with tube diameters reaching 1–1.5 μm (Figures 1b and 2). The SEM images clearly show evidence of tubes associating into larger assemblies. Dilution of the FF stock into the aqueous graphene dispersion led to immediate peptide–graphene assembly, and nanotubes are observed by SEM, with diameters of 500–1000 nm (Figures 1c and 1d). As shown in Figure 2, more tubes with a smaller diameter are visible in the peptide–graphene mixture than with peptide alone. Disappearance of the graphene flakes after the addition of FF is consistent with peptide–graphene assembly. As controls, we performed the same steps with the Ala-Ala dipeptide and separately with the FF peptide in HFIP. In both cases, nanotube assembly was not observed by SEM (Figures 1e and 1f).

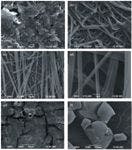
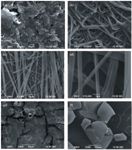
Figure 1: SEM images of (a): GR and 7XTE; (b): FF and 7XTE (c) and (d): FF and graphene in 7XTE; (e): Ala-Ala and 7XTE; (f): FF and HFIP. Grapheneâpeptide ratios were 1:1 with final concentrations of 0.67 mg/mL. The FF and Ala-Ala solutions had a concentration of 2 mg/mL.
We used CD spectroscopy to further confirm the formation of FF peptide nanotubes (Figure 3) where the CD curve obtained for the FF nanotubes is similar to that of the β-turn peptides with a minimum around ~190 nm and two maxima at ~200 nm and ~220 nm (27,28). The Ala-Ala control yields a spectrum that is indicative of random coil (29), with a characteristic minimum at 200 nm. The CD spectrum of the Ala-Ala peptide also indicates that it does not form any nanotubes (Figure 3).

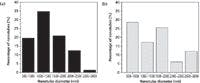
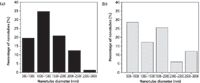
Figure 2: Distribution of nanotube diameters observed in SEM for the (a) FF and (b) FFâgraphene solutions.
We exploited the capabilities of UVRR spectroscopy, a nondestructive vibrational technique, to selectively examine the FF and graphene nanotubes by using an excitation wavelength that corresponds to an electronic transition. In our study, the FF and graphene nanotubes have two components with vibrational transitions that can be resonantly enhanced by tuning the excitation wavelength to match the electronic transition of each component. This selectivity allows us to probe the properties of FF and graphene while in assembly and thereby infer the intermolecular effects on self-assembly.

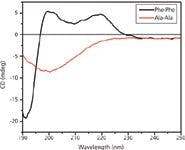
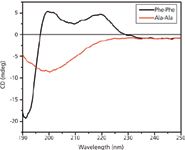
Figure 3: CD spectra of FF and Ala-Ala under aqueous conditions. Peptide concentrations are 0.04 mg/mL.
An excitation wavelength of 210 nm primarily enhances the phenylalanine residues, which gives rise to two strong modes at 1602 and 1583 cm-1 in the UVRR spectra of the FF–graphene and FF nanotubes (Figure 4). These bands result from ring C-C stretching vibrations (30). A total of six phenylalanine modes are observed and are consistent with those observed in the L-Phe spectrum. Substantial shifts in frequency and intensity are not observed when the FF nanotubes are formed or when the FF–graphene composite tubes are formed. In the FF–graphene spectrum, only modes from the Phe residues are observed and graphene modes are not detectable.

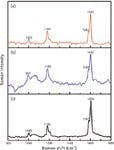
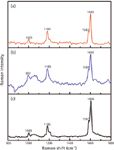
Figure 4: The UVRR spectra of the (a) FFâgraphene nanotubes, (b) FF nanotubes, and (c) L-phenylalanine monomer obtained at λexc = 210 nm. Peptide concentrations are ~1 mg/mL.
When an excitation wavelength of ~229 nm is used, we observe that modes from both the FF peptide and the graphene can be observed (Figure 5). As shown, at this excitation wavelength the vibrational modes in the 1000–1035 cm-1 region of the FF nanotubes are enhanced and dominate the FF spectrum. The UV Raman spectrum of the functionalized graphene nanoplatelet suspension exhibits two very distinct bands at 1691 cm-1 and 1736 cm-1. Graphitic materials have typically been characterized by a highly dispersive band in the 1200–1400 cm-1 region, called the disorder-induced D band, and the graphitic mode (G) at higher frequencies (~1590 cm-1), which is because of the stretching of sp2 atoms in the rings and chains (19,31). These modes are observed in the spectrum of the FF–graphene nanotubes, but they are small in intensity relative to the 1002 cm-1 band detected for the FF peptide. Nevertheless, they are distinct and occur at the same frequency as in the spectrum of the graphene suspension. The pronounced intensities of the FF modes arise from the resonance enhancement of that species at 229 nm.


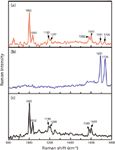
Figure 5: The UVRR spectra of the (a) FFâgraphene nanotubes, (b) graphene suspension, and (c) FF nanotubes obtained at λexc = 228.8 nm. Apart from the FF vibrational modes, the graphitic modes (1691 cm-1 and 1736 cm-1) can also be observed in the spectrum of FFâgraphene nanotubes.
When using an excitation wavelength of ~262 nm, we obtained spectra of the graphene suspension and the FF–graphene assemblies (Figure 6). At this wavelength, fluorescence from the FF peptide dominates the signal from the FF nanotubes, preventing us from collecting a UVRR spectrum with sufficient signal to discern the vibrational bands. Interestingly, the fluorescence does not obscure the signal in the FF–graphene nanotubes; however, in both spectra (FF–graphene nanotubes and graphene suspension) only two relatively sharp modes associated with graphene are observed at 1477 and 1516 cm-1. This demonstrates the selectivity of the UV excitation in enhancing the graphitic modes. The G modes observed with the 262-nm excitation are shifted to lower frequency relative to what was observed with 229-nm excitation and suggests that the functionalized graphene suspensions exhibit vibrational modes whose frequencies are dependent on the excitation wavelength.

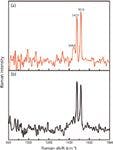
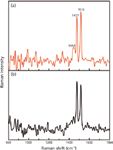
Figure 6: The UVRR spectrum of the (a) FFâgraphene nanotubes and (b) graphene suspension obtained at λexc = 262 nm showing the presence of G band splitting at 1477 cm-1 and 1516 cm-1.
Discussion
In this study, we show the utility of UVRR spectroscopy for characterizing FF–graphene assemblies and demonstrate that the components can be selectively investigated using different excitation wavelengths. The presence of nanotubes was verified visually using SEM and spectroscopically with CD spectroscopy. We further verified that these structures are unique to the FF-graphene mixtures as no nanotubes were observed in either the Ala-Ala-graphene mixture or in the mixture of FF peptides in HFIP (Figures 1e and 1f). We find that an excitation wavelength of 210 nm mainly yields features from the FF peptides (Figure 4), and longer wavelengths selectively (229 and 262 nm) enhance the graphene moiety. Both components are observed with an excitation of 229 nm and this might be the preferred wavelength if only one excitation line is available.
In the UVRR spectra obtained with excitation wavelengths of 229 and 262 nm (Figures 5 and 6), we mainly detect the graphitic G mode, consistent with previous UV Raman spectra of graphitic materials (32,33). The graphitic modes observed in our samples are higher in frequency compared to the typical graphitic peak at ~1600 cm-1 (21). Vibrational modes in the high frequency region, above 1600 cm-1, are localized on pairs of sp2 sites (21,22,34) and can vary greatly with the sp2 character (20–22,31). In materials containing sp2 chains, typical of diamond-like carbons (DLCs), the G peak occurs at frequencies greater than 1600 cm-1 and can reach 1690 cm-1 with 229 nm excitation, similar to what is observed in this study (31,34). The presence of distinct and intense vibrational modes in this high-frequency region that are dispersive and the absence of graphene modes around 1060 cm-1 are indicative of the high sp2 content of the graphene samples. The signal-to-noise ratio was not sufficient to observe the broad D band. Thus, UVRR spectroscopy can effectively characterize the nature of the graphene in these suspensions.
The frequency of the G mode can be affected by the addition of substituents, functionalization, and the number of layers making up the graphene sheets (21,22,32,35,36). Inclusion of disorder in nanocrystalline graphite decreases the frequency of the G peak from 1600 cm-1 to 1510 cm-1. Large shifts in the graphitic modes with variations in excitation energy, as seen in this study, are indicative of disorder, with the degree of dispersion related to the amount of disorder. Thus, the UVRR data collected using different excitation wavelengths also provides information on the relative order of these materials.
Tangential G band splitting has been noted for single-walled nanotubes because of their curvature (23,37). Such splitting leads to the observance of two very sharp bands of almost equal intensities, separated by 26–56 cm-1 (37). The sharp bands noted in the UV Raman spectra of our graphene suspension (Figures 5 and 6) are separated by 45 cm-1 at 229 nm and 33 cm-1 at 262 nm. The splitting observed suggests that the graphene flakes have some curvature and are not unilamellar graphene sheets. The presence of split graphitic modes in the peptide–graphene assembly further supports the finding that the splitting is curvature-induced. Interestingly, the frequency of the bands remains constant upon formation of the nanotubes, but the ratio of the intensities changes.
Conclusion
The present study demonstrates the utility of deep UVRR spectroscopy for the study and characterization of hybrid biomolecule–graphene nanotubular structures. In particular, we show that selective resonance enhancement of the components is achieved through variation of the laser excitation energy. This behavior could be useful in studying the properties of the individual components during assembly. Further applications of deep UVRR spectroscopy could be accomplished by extending such work to amyloidogenic peptides and their assemblies with graphene-based materials.
Acknowledgments
We would like to thank Jeff Gilarde of Wesleyan University for his assistance with the SEM, the National Science Foundation for funding (MCB-0843656), and Wesleyan University for research support.
References
(1) T.H. Han et al., Adv. Mater. 22(18), 2060–2064 (2010).
(2) A.K. Geim and K.S. Novoselov, Nat. Mater. 6(3), 183–191 (2007).
(3) K.S. Novoselov et al., Science 315(5817), 1379 (2007).
(4) K.S. Novoselov et al., Nature 438(7065), 197–200 (2005).
(5) G. Eda, G. Fanchini, and M. Chhowalla, Nat. Nanotechnol. 3(5), 270–274 (2008).
(6) C. Gomez-Navarro, M. Burghard, and K. Kern, Nano Lett. 8(7), 2045–2049 (2008).
(7) S. Stankovich et al., Nature 442(7100), 282–286 (2006).
(8) A.A. Balandin et al., Nano Lett. 8(3), 902–907 (2008).
(9) X. Li et al., Nat. Nanotechnol. 3(9), 538–542 (2008).
(10) T. Ramanathan et al., Nat. Nanotechnol. 3(6), 327–331 (2008).
(11) Y. Si and E.T. Samulski, Nano Lett. 8(6),1679–1682 (2008).
(12) L.A. Popova et al., J. Am. Chem. Soc. 132(18), 6324–6328 (2010).
(13) V. Sikirzhytski et al., J. Am. Chem. Soc. 130(18), 5852–5853 (2008).
(14) L. Sokolov and I. Mukerji, J. Phys. Chem. B 102(42), 8314–8319 (1998).
(15) L. Sokolov and I. Mukerji, J. Phys. Chem. B 104(46), 10835–10843 (2000).
(16) H.S. Shafaat et al., J. Raman Spectrosc. 40(8), 1060–1064 (2009).
(17) K.M. Knee et al., Biophys. Chem. 127(3), 181–193 (2007).
(18) I.K. Lednev et al., Anal. Bioanal. Chem. 381(2), 431–437 (2005).
(19) J. Filik, Spectrosc. Eur. 17(5), 8 (2005).
(20) S. Niyogi et al., Nano Lett. 10(10), 4061–4066 (2010).
(21) G. Irmer and A. Dorner-Reisel, Adv. Eng. Mater. 7(8), 694–705 (2005).
(22) K.W.R. Gilkes et al., J. Appl. Phys. 87(10), 7283–7289 (2000).
(23) T.R. Ravindran, B.R. Jackson, and J.V. Badding, Chem. Mater. 13(11), 4187–4191 (2001).
(24) A.C. Ferrari et al., Phys. Rev. Lett. 97(18), 187401 (2006).
(25) K.M. Knee and I. Mukerji, Biochemistry 48(41), 9903–9911 (2009).
(26) K.M. Knee et al., Biophys. J. 95(1), 257–272 (2008).
(27) M. Gupta et al., Advanced Materials 19(6), 858–861 (2007).
(28) D.A. Tinker et al., J. Biol. Chem. 263(11), 5024–5026 (1988).
(29) A.J. Adler, N.J. Greenfield, and G.D. Fasman, Methods Enzymol. 27, 675–735 (1973).
(30) Z. Chi et al., Biochemistry 37(9), 2854–2864 (1998).
(31) A.C. Ferrari, Solid State Commun. 143(1–2), 47–57 (2007).
(32) K. Kisoda et al., Appl. Phys. Lett. 97(3), 033108 (2010).
(33) I. Calizo et al., J. Appl. Phys. 106(4), 043509–043509-5 (2009).
(34) A.C. Ferrari and J. Robertson, Physical Review B 64(7), 075414 (2001).
(35) S. Niyogi et al., Nano Lett. 10(10), 4061–4066 (2010).
(36) K.N. Kudin et al., Nano Lett. 8(1), 36–41 (2008).
(37) Z. Li et al., Chem. Phys. Chem. 10(13), 2296–2304 (2009).
Anwesha Bhattacharya and Ishita Mukerji are with the Department of Molecular Biology and Biochemistry, in the Molecular Biophysics Program at Wesleyan University in Middletown, Connecticut.
Jennifer Cheng is also with Department of Molecular Biology and Biochemistry, in the Molecular Biophysics Program at Wesleyan University and the Department of Mechanical Engineering at the University of Bridgeport in Bridgeport, Connecticut
Shrinivas Bhosale is with the Department of Biomedical Engineering at the University of Bridgeport.
Prabir K. Patra is with the Department of Biomedical Engineering and the Department of Mechanical Engineering at the University of Bridgeport.
Ashish Aphale and Isaac Macwan are with the Department of Computer Science and Engineering, in the School of Engineering at the University of Bridgeport.
Direct correspondence to: imukerji@wesleyan.edu.


Newsletter
Get essential updates on the latest spectroscopy technologies, regulatory standards, and best practices—subscribe today to Spectroscopy.