Article
Spectroscopy
Spectroscopy
The C=O Bond, Part VIII: Review
Author(s):
We review the group wavenumbers of the many carbonyl-containing functional groups we have examined this year and discuss how to distinguish these functional groups from each other.
We have spent over a year exploring the infrared spectroscopy of carbonyl containing functional groups. Before we move on, we will review the group wavenumbers of the many C=O containing functional groups we have looked at, and discuss how to distinguish different carbonyl containing functional groups from each other.
For over a year now, we have been studying the infrared spectroscopy of the carbon-oxygen double bond, C=O, otherwise known as a the carbonyl group (1–8). Given the breadth of material covered, it makes sense to devote this column to a review.
Recall (1) the electronic structure of the carbonyl group, as seen in Figure 1. Carbonyl bonds are highly polar because of the large electronegativity difference between carbon and oxygen. As a result, the carbonyl carbon has a large partial positive charge, and the oxygen has a large partial negative charge. Recall that when in a chemical bond there are two charges separated by a distance it forms what is called a dipole moment (9). Additionally, remember that one of the things that determines the intensity of infrared peaks is the change in dipole moment with respect to bond length, dµ/dx, during a molecular vibration (9). And we have certainly seen that in pure substances containing a carbonyl group, the C=O stretch is almost always the strongest peak, and is one of the strongest peaks you will ever see in infrared spectra (9). For the functional groups we have examined, the C=O stretch typically falls between 1900 cm-1 and 1600 cm-1 (going forward, assume all peak positions are in cm-1, even if not so noted).

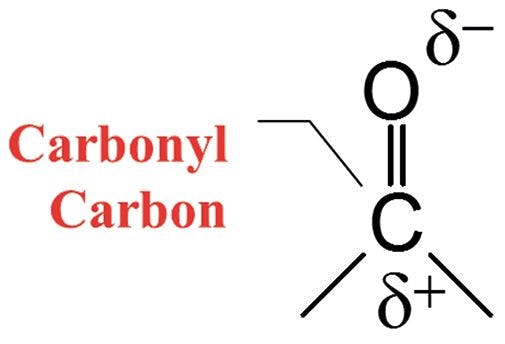
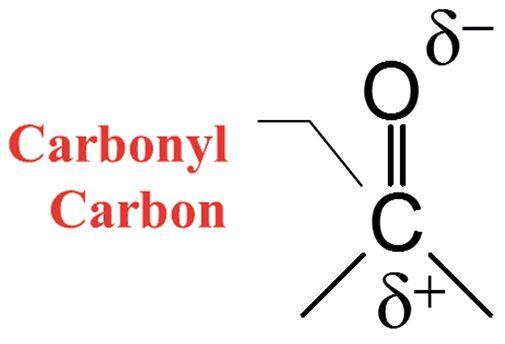
Figure 1: The chemical structure and charge distribution in a carbonyl bond.
Carbonyl bonds can be divided into two classes, depending upon what type of carbon(s) are attached to the carbonyl carbon. A saturated carbonyl group has only saturated carbons attached to the carbonyl carbon. An aromatic carbonyl group has one or more aromatic carbons attached to the carbonyl carbon. An example of an aromatic carbonyl group is seen in Figure 2.

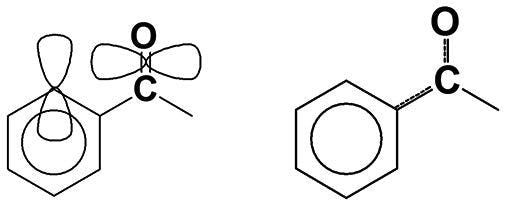

Figure 2: The p-type orbitals and conjugation within an aromatic carbonyl group.
Saturated and aromatic carbonyl groups can be distinguished from each other using infrared spectroscopy. In general, aromatic C=O stretching peaks fall ~30 cm-1 lower than saturated C=O stretching peaks. Aromatic rings, such as benzene, contain p-type orbitals with electron density that sticks up out of the plane of the molecule (10), as illustrated to the left in Figure 2. The carbonyl group also contains a p-type orbital that points through space towards the orbitals on the aromatic ring, as is also illustrated. The orbitals are close enough that they somewhat overlap, allowing a portion of the electron density from the carbonyl bond to be pulled off into the benzene ring, resulting in a phenomenon known as conjugation, which is illustrated at right in Figure 2. Conjugation weakens the C=O bond, lowers its force constant, and hence its peak position is lowered, on average about 30 cm-1 (1). Thus, for almost every carbonyl containing functional group, which we have discussed, two carbonyl stretching regions exist, one for the saturated and one for the aromatic versions of the functional group.
C=O Functional Groups Review
The ketone functional group has the chemical structure seen in Figure 3.


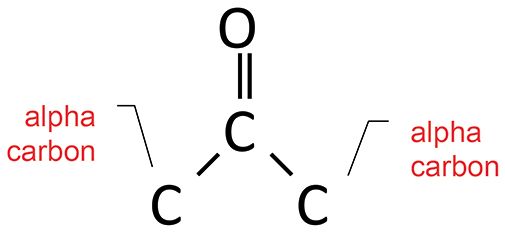
Figure 3: The structural framework of the ketone functional group.
Recall (1) that the two diagnostic group wavenumbers for ketones are the C=O stretch and the C-C-C stretch. For saturated ketones, these two peaks fall at 1750±10 and from 1230 to 1100.
Aldehydes feature a carbonyl carbon and a unique aldehydic hydrogen bonded to the carbonyl carbon, as seen in Figure 4.

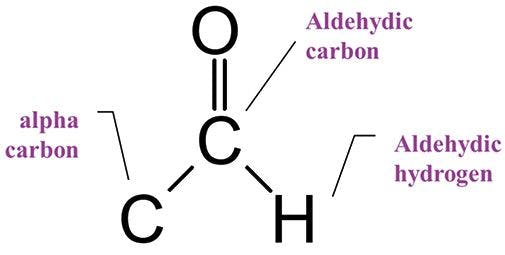

Figure 4: The structural framework of the aldehyde functional group.
Recall (2) that the electronegative oxygen atom pulls off electron density from the aldehyde's C-H bond, giving an unusually low wavenumber C-H stretch between 2850 and 2700. For saturated aldehydes, the C=O stretch falls at 1730±10, while for aromatic aldehydes, it is found from 1710–1685. The diagnostic pattern to remember for aldehydes then is an unusually low C-H stretch, combined with a carbonyl stretch.
Carboxylic acids are weak acids whose chemical structure is seen in Figure 5.


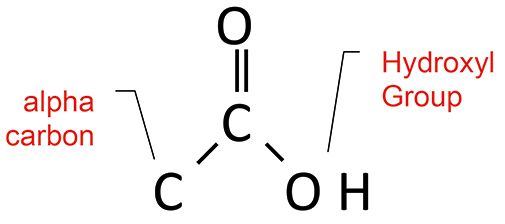
Figure 5: The structural framework of the carboxylic acid functional group. Note the locations of the alpha carbon and the hydroxyl group.
Because of the strong hydrogen bonding that takes place in carboxylic acids, the peaks from the acid group are unusually broad and easy to spot. The O-H stretch is a broad envelope of absorbance from 3500 to 2500. This is one of the broadest peaks you will ever observe in an infrared spectrum (3).
The carbonyl stretch for saturated acids falls from 1730 to 1700, while for aromatic acids it falls from 1710 to1680. Carboxylic acids also have a C-O stretch from 1320 to 1210, and a broad O-H wag at 960 to 900. This functional group is unusual in that it has four useful group wavenumbers. However, for diagnostic purposes, the pattern easiest to remember is that the combination of a broad O-H stretch and a carbonyl group indicates a carboxylic acid.

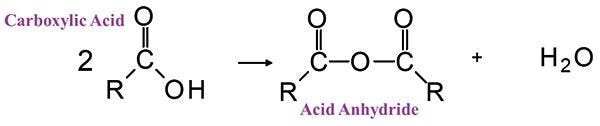
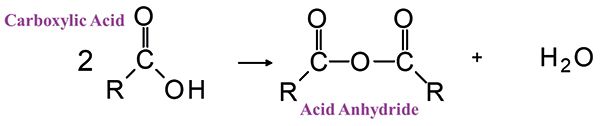
Figure 6: The reaction of two carboxylic acid molecules to give an acid anhydride and water.
Acid anhydrides (4) are made by reacting two carboxylic acid molecules to obtain the structure seen in Figure 6.


The unusual double carbonyl structure of anhydrides means there are not one but two carbonyl stretching peaks. Anhydride structures can be categorized as saturated non-cyclic, unsaturated non-cyclic, saturated cyclic, and unsaturated cyclic. The position and relative intensity of the two carbonyl stretching peaks can be used to distinguish the four types of anhydrides from each other. This information is summarized in Tables 1 and 2.


Carboxylates (5) are made by reacting carboxylic acids with strong bases to produce the structure seen in Figure 7.

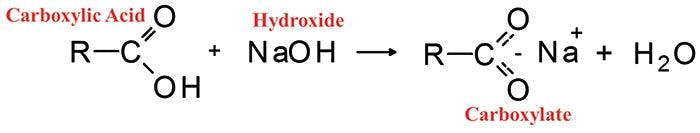

Figure 7: The reaction of a carboxylic acid with sodium hydroxide to give a carboxylate and water.
Note that carboxylates do not have a carbonyl group, hence no carbonyl stretching peak. Instead, they have two intense carbon-oxygen bond-and-a-half stretches that fall from 1650 to 1540 and 1450 to 1360, respectively.
Esters have the molecular structure seen in Figure 8.


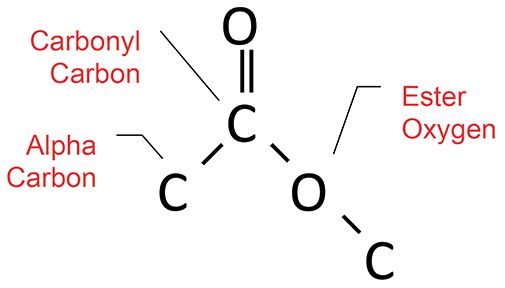
Figure 8: The molecular structure of the ester functional group.
Recall (7, 8) that esters follow the Rule of Three, with three intense peaks at about 1700, 1200, and 1100. These are from the C=O, C-C-O, and O-C-C stretches, respectively. Saturated and aromatic esters both follow the Rule of Three, but have different sets of peaks, any of which can be used to distinguish the two types of ester. Group wavenumbers for saturated and aromatic esters are summarized in Table 3.


Organic carbonates can be thought of as two esters put together, as seen from the structure in Figure 9.

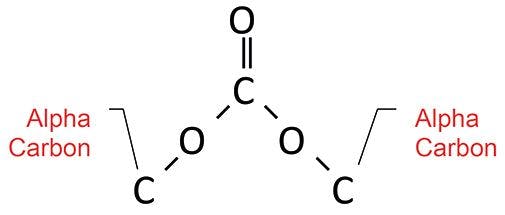
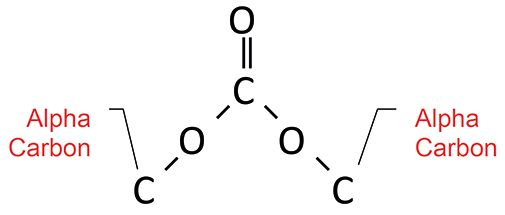
Figure 9: The molecular framework of an organic carbonate.
Carbonates are found in three classes: saturated carbonates where both alpha carbons are saturated, mixed carbonates where one alpha carbon is saturated and the other is aromatic, and aromatic carbonates where both alpha carbons are aromatic. Like esters, organic carbonates follow their own Rule of Three (8), with peaks from C=O, O-C-O, and O-C-C stretches. Their diagnostic group wavenumbers are found in Table 4.


Note that, for many carbonyl containing functional groups, their C=O stretches fall in overlapping ranges. This is why, as I have emphasized (1), that the C=O stretch by itself should never be used to determine the presence of a functional group in a sample. Other peaks, as we have learned (1-8), need to be used to obtain a proper identification.
Carbonyl Functional Group Summary
1. Ketones have a carbonyl stretch around 1700 cm-1, and a C-C-C stretch around 1200 cm-1. They have no other strong infrared bands and their spectra are relatively simple.
2. The distinguishing structural feature of an aldehyde is the aldehydic hydrogen, which is isolated from the rest of the molecule by the carbonyl group. The aldehydic hydrogen gives rise to a unique, low wavenumber C-H stretch between 2850 and 2700. Aldehydes also have a C=O stretch just above 1700 cm-1. The combination of a low wavenumber C-H stretch and a carbonyl stretch are strong indicators of an aldehyde.
3. Carboxylic acids have an O-H bonded to the carbonyl carbon and, due to strong hydrogen bonding, have unusually wide bands. An O-H stretch combined with a C=O stretch are diagnostic for carboxylic acids.

Quiz Section: Answer to the September Quiz
4. Carboxylates are derivatives of carboxylic acids. Carboxylates have two "bond and a half" C-O linkages that give rise to two strong bands from the asymmetric and symmetric stretches at 1650 to 1540 and 1450 to 1360.
5. Anhydrides contain two carbonyl groups, so they have two C=O stretches. The position and relative intensity of these bands can tell whether an anhydride is straight chain or cyclic, and whether it is saturated or aromatic. Their group wavenumbers are summarized in Tables I and II.
6. Esters follow the Rule of Three: a pattern of three intense bands at ~1700, ~1200, and ~1100 cm-1. These bands are due to C=O, C-C-O, and O-C-C stretching. Saturated and aromatic esters have different sets of these bands.
7. Organic carbonates contain a CO3 moiety. The C=O and O-C-O stretching vibrations help distinguish between saturated, mixed, and aromatic carbonates.
References
(1) B.C. Smith, Spectroscopy 32(7), 18–24 (2017).
(2) B.C. Smith, Spectroscopy 32(9), 31–36 (2017).
(3) B.C. Smith, Spectroscopy 32(11), 28–34 (2017).
(4) B.C. Smith, Spectroscopy 33(1), 14–20 (2018).
(5) B.C. Smith, Spectroscopy 33(3), 16–20 (2018).
(6) B.C. Smith, Spectroscopy 33(5), 20–23 (2018).
(7) B.C. Smith, Spectroscopy 33(7), 20–23 (2018).
(8) B.C. Smith, Spectroscopy 33(9), 24–28 (2018).
(9) B.C. Smith, Spectroscopy 30(1), 16–23 (2015).
(10) B.C. Smith, Spectroscopy 31(3), 34–37 (2016).


Brian C. Smith, PhD,

Brian C. Smith, PhD, has more than three decades of experience as an infrared spectroscopist. He has published numerous peer reviewed papers and has written three books on the subject: Fundamentals of FTIR and Infrared Spectral Interpretation, both published by CRC Press, and Quantitative Spectroscopy: Theory and Practice published by Elsevier. As a spectroscopy trainer, he has helped thousands of people around the world improve their infrared analyses. He earned his PhD in physical chemistry from Dartmouth College. He can be reached at: SpectroscopyEdit@UBM.com


Newsletter
Get essential updates on the latest spectroscopy technologies, regulatory standards, and best practices—subscribe today to Spectroscopy.


