Spectroscopy
Howard Mark and Jerome Workman, Jr. continue their discussion of the derivation of the principal component algorithm using elementary algebra.
Spectroscopy
Howard Mark and Jerome Workman, Jr. continue their discussion of the derivation of the principal component algorithm using elementary algebra.
Spectroscopy
Howard Mark and Jerome Workman, Jr. continue their discussion of the derivation of the principal component algorithm using elementary algebra.
Spectroscopy
Howard Mark and Jerome Workman, Jr. continue their discussion of the derivation of the principal component algorithm using elementary algebra.
Spectroscopy
In this month's installment, columnists Howard Mark and Jerome Workman, Jr. present the derivation of the principal component algorithm using elementary algebra.
Spectroscopy
Columnists Howard Mark and Jerome Workman, Jr. discuss the application of chemometric methods of relating measured NIR absorbances to compositional variables of samples.
Spectroscopy
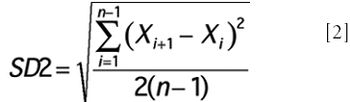
This column is the continuation of a series (1-5) dealing with the rigorous derivation of the expressions relating the effect of instrument (and other) noise to its effects on the spectra we observe. Our first column in this series was an overview. While subsequent columns dealt with other types of noise sources, the ones listed analyzed the effect of noise on spectra when the noise is constant detector noise (that is, noise that is independent of the strength of the optical signal). Inasmuch as we are dealing with a continuous series of columns, on this branch in the thread of the discussion, we again continue the equation numbering and use of symbols as though there were no break. The immediately previous column (5) was the first part of this set of updates of the original columns.
Spectroscopy
Columnists Howard Mark and Jerome Workman, Jr. respond to reader feedback regarding their 14-part column on the analysis of noise in spectroscopy by presenting another approach to analyzing the situation.
Spectroscopy
In the second part of this series, columnists Jerome Workman, Jr. and Howard Mark continue their discussion of the limitations of analytical accuracy and uncertainty.
Spectroscopy
September 2006. In the first part of this two-part series, columnists Jerome Workman, Jr. and Howard Mark discuss the limitations of analytical accuracy and uncertainty.
Spectroscopy
In this month's installment of "Chemometrics in Spectroscopy," the authors again explore that vital link between statistics and chemometrics, this time with an emphasis on the statistics side.
Spectroscopy
In this month's installment of "Chemometrics in Spectroscopy," the authors explore that vital link between statistics and chemometrics, with an emphasis on the chemometrics side.
Spectroscopy
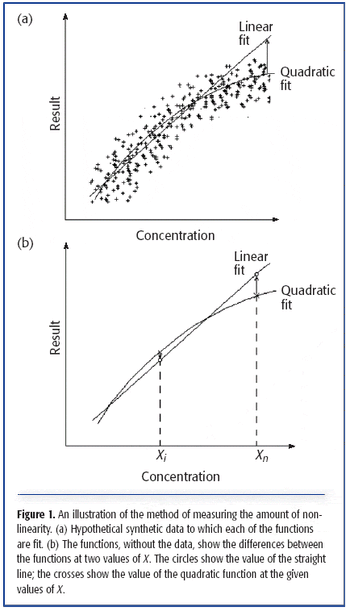
At this point in our series dealing with linearity, we have determined that the data under investigation do indeed show a statistically significant amount of nonlinearity, and we have developed a way of characterizing that nonlinearity. Our task now is to come up with a way to quantify the amount of nonlinearity, independent of the scale of either variable, and even independent of the data itself.
Spectroscopy
This column presents results from some computer experiments designed to assess a method of quantifying the amount of non-linearity present in a dataset, assuming that the test for the presence of non-linearity already has been applied and found that a measurable, statistically significant degree of non-linearity exists.
Spectroscopy
Previous methods for linearity testing discussed in this series contain certain shortcomings. In this installment, the authors describe a method they believe is superior to others.
Spectroscopy
This third part in a series on non-linearity looks at other tests and how they can be applied in laboratories that must meet FDA regulations.
Spectroscopy
A discussion of how DW can be a powerful tool when different statistical approaches show different sensitivities to particular departures from the ideal.
Special Issues
A paradigm shift is required for chemists and engineers to best utilize chemometrics in their processes. This change demands that one not be too fixated upon ideal textbook thermodynamic models but instead continually check these models using real-time data input and chemometric analysis. The author discusses implementation strategies and the benefits that chemometrics can bring to the process environment.
Spectroscopy
The authors at how linearity considerations fit into the broader scheme of calibration theory, and discuss methods for testing data for non-linearity.
Spectroscopy
Howard Mark and Jerry Workman revisit their recent series on derivatives, marking their 100th column contribution to Spectroscopy.
Spectroscopy
Part IV of the series describes the use of confidence limits in data analysis for calculating slope and intercept.
Spectroscopy
The authors continue their discussion of computing confidence limits for the correlation coefficient in developing a calibration for quantitative analysis.
Spectroscopy
The authors continue their discussion of the correlation coefficient in developing a calibration for quantitative analysis.
Spectroscopy
The authors begin a discussion of the statistical tools available to compare and correlate two or more data sets.
Spectroscopy
The fourth installment in the continuing series concentrates on issues that are amenable to mathematical analysis.
Spectroscopy
This series about derivatives in spectroscopy continues with a discussion about some of the practical aspects of computing the derivative.
Spectroscopy
The authors continue their series on derivatives in spectroscopy.
Spectroscopy
The authors begin a new series of columns about derivatives of spectra.
Spectroscopy
Part 14 of the ongoing series.
Spectroscopy
Part 13 of the ongoing series-within-a-series.