Publication
Article
Spectroscopy
Errors and Mistakes to Avoid when Analyzing Raman Spectra
Seven common mistakes in the analysis of Raman spectra can lead to overestimating the performance of a model.
Raman spectroscopy is an inelastic scattering process on a quantified energy system where vibrational energy levels are typically measured. The technique provides an indirect measurement of vibrational energy levels within the sample and hence can characterize the biochemical composition of a sample. Normally, Raman spectroscopy is applied in a label-free manner, in contrast to using fluorescence labels, surface-enhanced Raman spectroscopy (SERS) labels, or Raman tags. The unlabeled Raman measurement provides a characteristic and phenotypical molecular fingerprint of the sample. In combination with artificial intelligence (AI) methods, such as chemometrics and machine learning, this fingerprint can be translated into high-level information. Because of the weakness of the Raman effect, AI-based data analysis pipelines are constructed, which aim at correcting, standardizing, and purifying the Raman data before the translating of high-level information can take place.
Data Analysis Pipeline for Raman Spectra
The data analysis pipeline for Raman spectra contains a sequence of algorithms to correct, standardize, and purify the measured Raman data. The data analysis pipeline starts with correcting cosmic spikes originating from high-energy cosmic particles or their secondary particles. Sometimes, other artifacts, such as fixed pattern noise, are removed as well. The next step deals with the wavelength, wavenumber, and intensity calibration. The first two calibration steps aim to generate a stable wavenumber axis with respect to the excitation wavelength. Generating a stable wavenumber is necessary because in Raman spectroscopy a relative measurement with respect to the excitation wavelength is performed. The intensity calibration aims at generat- ing setup-independent Raman spectra by correcting the spectral transfer function of optical components, such as lenses, filters, dispersive elements, and the quantum efficiency of the detector. After this step, multiple preprocessing methods are applied, which further standardize the data. This preprocessing block typically contains a baseline correction, because the Raman effect overlaps energetically with fluorescence. Thereafter, a denoising and a normalization step are applied to make spectra from different measurement days comparable. Denoising is not always applied, but the mixed Poisson–Gaussian noise needs to be considered in the selection of the algorithm. Finally, a feature extraction or dimension reduction (such as principal component analysis, or PCA) is applied. The selected features are further analyzed using classical machine learning or chemometric models. These last two steps can be combined with deep learning methods. Finally, these machine learning or deep learning models included in the whole data analysis pipeline are evaluated to judge the generalization performance of the models; that is, its performance on a new data set. Finally, the models are interpreted with visualization approaches.
Mistakes While Analyzing Raman Spectra
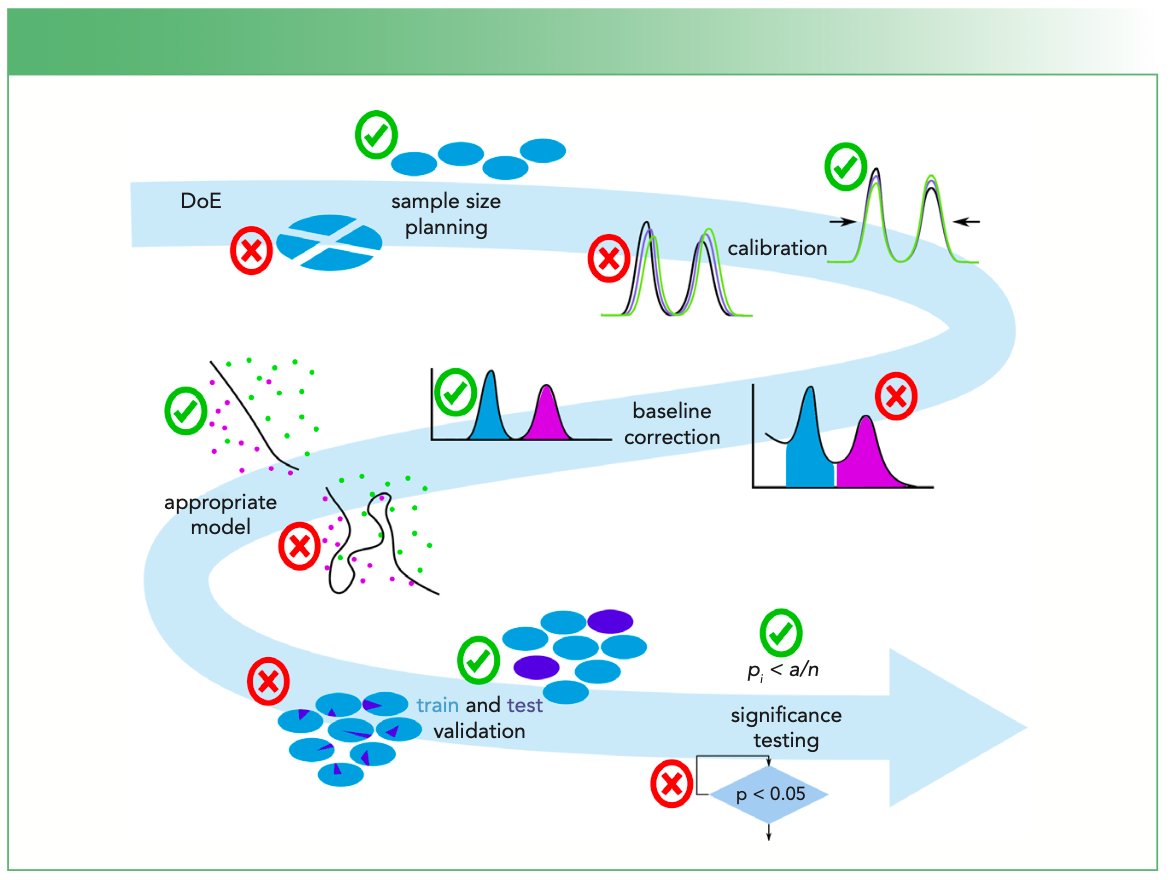
The above described data analysis pipeline is described elsewhere (1) and sometimes there are changes in the ordering of the algorithms based on researchers’ idea of their data. Nevertheless, here we want to focus on specific problems or mistakes that should be avoided. These mistakes are shown in Figure 1 and these potential mistakes are explained in more detail below.

 over independent measurements. Finally, the multiple testing problem needs to be corrected for and the correct statistical tests need to be applied.")
FIGURE 1: A visualization of the mistakes within the data analysis pipeline for Raman spectra. The mistakes are indicated in the arrow with respect to the location within the data analysis pipeline. The mistakes may arise from the sample size planning, which should determine enough independent observations. Thereafter, a wavenumber, wavelength, and intensity calibration are performed. The baseline correction is important, but the normalization should be done after the baseline correction. The complexity of the model is linked to the number of independent observations and the model should not be too complex. Thereafter, an unbiased estimation of the model generalizability is needed, which requires a cross-validation (or test validation) over independent measurements. Finally, the multiple testing problem needs to be corrected for and the correct statistical tests need to be applied.
Mistake #1: Absence of Independent Samples
The first critical issue is sample size planning, which is important because a sufficient quantity of independent data is needed to training and test data-driven AI models. It is advisable to measure at least three independent replicates in cell studies (five is preferable) and roughly 20–100 patients for diagnostic studies (2), which is especially important for the model evaluation, as discussed further in this tutorial (see mistake #6).
Mistake #2: Skipping Calibration
Generally, it is advisable to measure a wavenumber standard like 4-acetamidophenol with a high number of peaks in the wavenumber region of interest. These measurements can be used to construct a new wavenumber axis for each measurement day, which is subsequently interpolated to a common and fixed wavenumber axis (3). If this wavenumber (wavelength) calibration is not performed, systematic drifts in the measurement system overlap with possible sample related changes. An optimal spectrometer calibration is focus of ongoing research, but a white light measurement should be done every week or when the setup is modified. If these spectra (wavenumber standard or white light spectra) are not used for calibration, they can act as quality control measurements.
Mistake #3: Over-Optimized Preprocessing
Because Raman spectra overlap with fluorescence and the fluorescence background can be 2–3 orders more intense than the Raman bands, a baseline correction or other approach, like performing the derivative, is important (4). Nevertheless, it is hard so select good parameters of the baseline correction and a grid search or optimization should be performed. To avoid overfitting, it is preferable to utilize spectral markers as the merit of such optimization rather than the performance of the model.
Mistake #4: Performing Spectral Normalization Before Background Correction
Sometimes, it is seen that spectral normalization is performed before the background correction, resulting in a strong bias of the normalized Raman spectra. The fluorescence background and its intensity are coded within the normalization constant and hence every model might be biased. This issue should be avoided. Baseline correction needs to be done before normalization is performed.
Mistake #5: Selecting an Unsuitable Model
Depending on the number of independent measurements, the model and its complexity should be selected. For large independent data sets, modeling with a highly parameterized model such as a deep learning model can and should be applied. If the data set contains only a few independent observations, low-parameterized models should be used, such as linear models.
Mistake #6: Model Evaluation Errors
Another mistake that is often seen relates to the model evaluation (cross-validation or training validation). It is paramount that the different data sets within the validation be independent. To fulfill this requirement, biological replicates or patients, which act as independent measurements, need to be in either a training, validation, or test data subset. If this requirement is violated, the model and its performance is highly overestimated. In a previous study, we could show that a model with 60% classification accuracy, which was evaluated reliably (replicate-out cross-validation), was overestimated to nearly 100% classification accuracy with normal cross-validation (5). The main problem that can arise is an information leakage between the data sets that leads to a bias in the model performance estimation.
Mistake #7: P-value hacking
The last mistake that is often encountered is when a statistical analysis is performed on band intensities. If multiple Raman intensities are tested, then a Bonferroni correction that accounts for the alpha-error cumulation is needed. This issue occurs when 100 tests are performed, roughly five are positive by chance alone if an error probability of 95% is used. The second point is that a t-test is normally not applicable because the assumptions are not meet. Therefore, nonparameterized alternative tests like the Mann-Whitney-Wilcoxon U test should be used.
Conclusion
These seven mistakes are often seen in publications about Raman spectroscopy and should be avoided, because they affect the final performance estimate of the model. These biased performance estimates need to be interpreted with caution, especially when Raman spectroscopy together with AI-based modeling is used in real world applications such as clinical diagnostics.
Acknowledgment
The financial support given from the European Union (EU), the Thüringer Ministerium für Wirtschaft, Wissenschaft und Digitale Gesellschaft, the Thüringer Aufbaubank, the Federal Ministry of Education and Research, Germany (BMBF), the German Science Foundation, the Fonds der Chemischen Industrie, and the Carl-Zeiss Foundation are greatly acknowledged.
References
(1) S. Guo, O. Ryabchykov, N. Ali, R. Houhou, and T. Bocklitz, in Reference Module in Chemistry, Molecular Sciences, and Chemical Engineering (Elsevier, Amsterdam, The Netherlands, 2020). https://doi.org/10.1016/B978-0-12-409547-2.14600-1.
(2) N. Ali, S. Girnus, P. Roesch, J. Popp, and T.W. Bocklitz, Anal. Chem. 90, 12485–12492 (2018). https://doi.org/10.1021/acs.analchem.8b02167.
(3) T.W. Bocklitz, T. Dörfer, R. Heinke, M. Schmitt, and J. Popp, Spectrochim. Acta. A. Mol. Biomol. Spectrosc. 5, 544–549 (2015). https://doi.org/10.1016/j.saa.2015.04.079.
(4) S. Guo, T. Bocklitz, and J. Popp, Analyst 141, 2396–2404 (2016). https://doi.org/10.1039/C6AN00041J.
(5) S. Guo, T. Bocklitz, U. Neugebauer, and J. Popp, Anal. Methods 9(30), 4410–4417 (2017).
Oleg Ryabchykov and Iwan Schie are with the Leibniz Institute of Photonic Technology in Jena, Germany. Jürgen Popp and Thomas Bocklitz are with the Leibniz Institute of Photonic Technology in Jena, Germany, and with the Institute of Physical Chemistry and Abbe Center of Photonics at Friedrich-Schiller University in Jena, Germany. Direct correspondence to: thomas.bocklitz@uni-jena.de ●


Newsletter
Get essential updates on the latest spectroscopy technologies, regulatory standards, and best practices—subscribe today to Spectroscopy.


