
Spectroscopy
This column is the continuation of our discussion in part I dealing with statistics.
Spectroscopy
This column is the continuation of our discussion in part I dealing with statistics.

Spectroscopy
The use of Raman spectroscopy to produce material images whose contrast is derived from chemical or crystallographic species has been seen as quite useful since the introduction of the Raman microscope in 1976, but particularly, more recently, with the development of more sensitive and easier-to-use instruments. When the various species in the field of view have spectra with non-overlapping analytical bands, simple univariate analysis can provide good images. When overlapping bands are present, multivariate techniques, especially MCR (Multivariate Curve Resolution), have been successfully applied. However, there are cases where even MCR results may be problematic. We will look at some maps of a ceramic composite containing SiC, Si, B4C, and Carbon, where each of these species has non-unique spectra to see what type of results flexible software can produce. What is the goal in this type of exercise? For some of us, creating images is like a teenager’s computer game. But really what we are trying to do is to extract information about a sample from its Raman image. A beautiful rendition is nice, but it must yield information. The following will show how Raman maps can provide useful information on a sample.
Spectroscopy
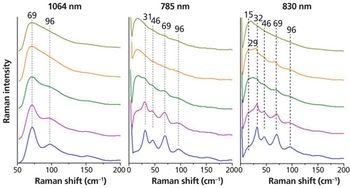
Crystallinity is an important factor when producing pharmaceuticals as it directly affects the bioavailability of the drug. Low frequency Raman spectroscopy offers some advantages to the detection and analysis of crystallinity in pharmaceutical samples. Here the experimental requirements for low frequency Raman measurements are described. The application to the study of crystallinity with a number of examples is discussed and the advantages and limitations of this technique are highlighted and compared with other techniques.
Spectroscopy
A tribute to a great scientist and a great man.
Spectroscopy
Matthew Baker of the University of Strathclyde in Glasgow, Scotland, discusses his work using ATR combined with FT-IR spectroscopy for the analysis of biological samples.
Spectroscopy
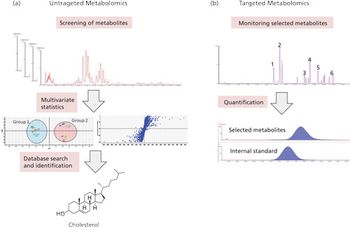
A look at the various strategies and tools related to metabolomics applied to food and nutrition.
Spectroscopy
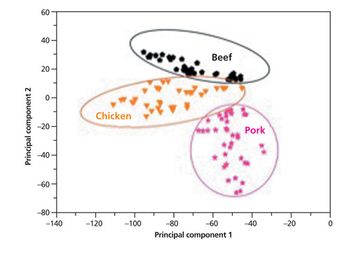
Ismail Hakki Boyaci of the Food Research Center at Hacettepe University has developed a method using laser-induced breakdown spectroscopy (LIBS) to detect meat adulteration.
Spectroscopy
Joanna Szpunar of the National Research Council of France discusses her use of ICP-MS methods to detect trace levels of human selenoproteins in cell extracts and for the identification of selenium containing proteins in rice.
Spectroscopy
Click the title above to open the Spectroscopy February 2016 regular issue, Vol 31 No 2, in an interactive PDF format.