Article
Spectroscopy
Spectroscopy
LIBS at the Submicrometer Scale
Author(s):
Vassilia Zorba of Lawrence Berkeley National Laboratory in Berkeley, California, discusses what her studies have revealed about the mechanisms of plasma emission at small scales and what she has found when applying femtosecond LIBS to the study of advanced battery materials.
In many advanced materials applications, such as the development of thin films or materials for advanced battery storage, the resolution requirements for elemental imaging usually range from the nanometer to submicrometer scale. Laser-induced breakdown spectroscopy (LIBS) used with a femtosecond laser appears to be a useful technique for such studies, but fully harnessing its capabilities requires gaining a better understanding of laser-induced plasma emission at the submicrometer scale. Vassilia Zorba of Lawrence Berkeley National Laboratory in Berkeley, California, talked to us about what her studies have revealed about the mechanisms of plasma emission at small scales and what she has found when applying femtosecond LIBS to the study of advanced battery materials.
You have been exploring femtosecond LIBS at the micrometer and submicrometer scale. What drove you to apply LIBS to analysis at this scale?
In any elemental analysis or elemental imaging application, the spatial resolution has to be commensurate with the size of the smallest feature that we want to chemically resolve. For many types of advanced material applications, such as next-generation-energy related materials (generation, conversion, storage), particle analysis, thin films, and interfaces, the resolution requirements usually range from the nanometer to submicrometer scale. Spatial resolution in LIBS is defined by the size of the ablation crater and is typically several tens to hundreds of micrometers in diameter (macroscale). Our focus is on pushing LIBS to smaller length scales and its use in high-resolution elemental imaging in some of these emerging applications.
What makes measurements at these small length scales a challenge? What are the advantages of using femtosecond LIBS at that scale?
Laser-induced plasma emission at the submicrometer scale is a “black box.” There is very little that we know about plasma properties and emission mechanisms and how they compare to the macroscale. Better resolution in LIBS means that we are ablating less mass and therefore detection of the emission may be quite challenging. The best we can currently do in terms of spatial resolution with femtosecond LIBS is a little less than 500 nm, corresponding to absolute limits of detection of the hundreds of attograms (1).
Femtosecond lasers are ideal for high-resolution LIBS. This has to do with their fundamentally different laserâmaterial interaction compared to nanosecond lasers. Nonlinear absorption enables spatial and axial confinement of the femtosecond laser beam, and suppressed thermal effects reduce signs of sample melting, resolidification, and thermal load on the sample. All of these parameters help us achieve precise sampling with well-defined craters, which under certain conditions may even be below the diffraction limit.
In a recent study (2), you used femtosecond LIBS to analyze copper at the micrometer and submicrometer scale, and studied the LIBS spectral emission characteristics and the plasma properties. What did you find about how the spectral emission characteristics and plasma properties of femtosecond LIBS at the micrometer and submicrometer scale differ from those at the macroscale?
This study showed that the electron number density and excitation temperature are really not that different from those reported in macroscale femtosecond LIBS, despite the fact that the ablated mass is orders of magnitude smaller (see Figure 1 for an example of results obtained in the study). Intuitively we expect that the less mass we have, the smaller the LIBS signal intensity will be, which is true. However, the emission efficiency-the ratio of the emission intensity over the ablated material volume-is reduced as we scale down in mass. In other words, it’s not just that we have less mass, but that a smaller percentage of species in that mass lead to detectable LIBS emission.

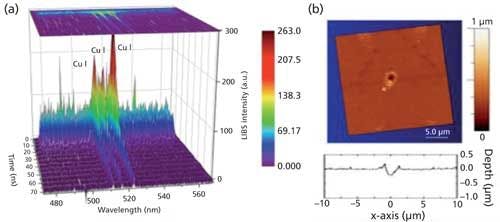

Figure 1: (a) Example of time-resolved LIBS spectral emission from a few-micrometer crater in Cu showing short persistence time. (b) Atomic-force microscopy (AFM) surface map of a submicrometer Cu crater and its surface profile, generated by a single femtosecond laser pulse.
What does this information tell us about how to improve femtosecond LIBS or how to better harness its capabilities?
These results really give us a first insight into the mechanisms of plasma emission at small scales. It is inevitable that after a certain point when the ablated mass is very limited (less than attogram scale), we will no longer detect LIBS spectral emission in the optical far-field. At this scale, secondary excitation mechanisms start to become much more significant so that we can re-excite or reheat the existing plasma. To maintain the spatial resolution provided by the femtosecond laser ablation, it is important to look for approaches in which the secondary source only interacts with the plasma and not the sample. One of the more straightforward approaches for this is orthogonal double-pulse LIBS, where the ablation and re-excitation pulses are perpendicular to one another.
Large concentrations of nanoparticles are known to be present in femtosecond-laser-induced plasmas at the macroscale. What is the influence of nanoparticles in the plasma in femtosecond LIBS at the micrometer and submicrometer scale?
In previous work on ultraviolet femtosecondânanosecond double-pulse LIBS at the micrometer scale, we found that emission intensity enhancement of two orders of magnitude is possible for Si at these small length scales (3), which is quite significant, especially considering how little ablated mass there is to begin with. In that work we demonstrated evidence for the presence of nonradiative species or particles in small-scale plasmas that remain long after LIBS emission has ended. The differences we observed in emission efficiency (2) may be attributed to an increasing concentration of nonemitting nanoparticles versus emitting species as we scale down in laser energy and crater sizes.
You have used femtosecond LIBS to study the solid electrolyte interphase (SEI) in rechargeable lithium-ion batteries (4). What is the SEI and why is understanding it important for improving the performance of these batteries?
The SEI is a thin interfacial layer with a thickness of a few tens of nanometers that forms spontaneously on Li-ion battery electrodes upon the early stages of charging in liquid electrolytes. This interfacial layer affects the entire cell electrochemical behavior, cell lifetime, and safety performance. The SEI is also thermodynamically unstable with nonuniform composition and morphology. Because of the SEI’s direct impact on battery performance, controlling the SEI’s exact composition and understanding its formation mechanism is considered one of the greatest challenges in Li-ion battery fundamental research.
What advantages does LIBS have for studying the SEI, compared to other techniques?
Because of the thinness of the SEI layer, there is a need for techniques that can provide information on its chemical composition with very high depth resolution (<10 nm). Figure 2 shows results from the femtosecond LIBS analysis of a highly oriented pyrolytic graphite layer at a depth resolution of 7 nm. At the same time, characterization can be difficult because of the instability of the layer; handling the material in air or transferring it to vacuum may affect the chemical composition or mechanical stability of the layer, or both. The advantages of femtosecond LIBS for the characterization of SEI layers are that as an all-optical technique, femtosecond LIBS allows analysis in their inherent environment (a He or Ar atmosphere is common ex situ), it can provide information as a function of depth, and it is a technique that is inherently very sensitive to Li. This is a fairly unique combination of characteristics that is extremely hard to find in most spectroscopic techniques.

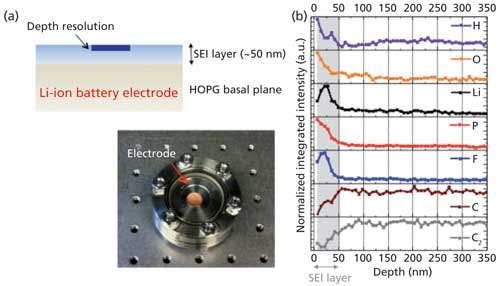
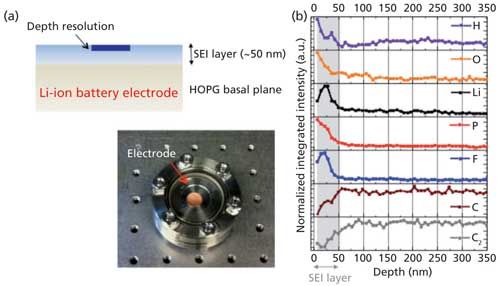
Figure 2: (a) Illustration of an SEI layer on a highly oriented pyrolytic graphite (HOPG) electrode and a picture of the charged electrode in the He-filled sampling chamber. (b) Depth-resolved analysis of the SEI layer using femtosecond LIBS. Depth resolution was 7 nm.
You have also used femtosecond LIBS to carry out three-dimensional elemental imaging of Li7La3Zr2O12 (LLZO)-an alternative solid-state material for Li-ion batteries (5). Why is it necessary to study these materials at this scale? What can femtosecond LIBS reveal about these materials that other techniques cannot?
LLZO is a solid-state electrolyte, which is a safer material for large-format Li-ion battery applications such as electric vehicles. Partial Al-substitution in LLZO, which is used to stabilize the cubic structure, introduces new impurity phases, chemical composition changes, and elemental distribution gradients at surfaces, at grain boundaries, and in the bulk of the material. Because of their low concentrations and distribution patterns, these impurities, changes, and gradients are often difficult or impossible to detect by conventional characterization techniques, but they still greatly affect the electrochemical properties of LLZO.
Some of the more common techniques used for the analysis of solid-state electrolytes such as LLZO are inductively coupled plasmaâoptical emission spectroscopy (ICP-OES) and ICP-mass spectrometry (ICP-MS), which do not provide spatially resolved information, and energy-dispersive spectroscopy (EDS), which is limited to surface composition and has reduced sensitivity to Li. We found that femtosecond LIBS is a very powerful technique that provides high sensitivity two dimensionally (2D) layer-by-layer, in 2D cross-sectional analysis, and for three-dimensional (3D) imaging, all of which allow us to visualize the distribution of major and minor elements of interest in LLZO matrices. This information, combined with complementary spectroscopies and electrochemical characterization, is important for improving the fabrication process of solid-state electrolytes.
Why was 3D mapping important in this study? And are there any significant challenges to converting the data into 3D maps?
Visualization of the distribution of the elements in the LLZO matrix was important to extract the atomic ratios of major and minor elements below the material surface, and to find correlations with their electrochemical behavior (Figure 3). The main challenge in data visualization is that as the resolution (spatial or axial) increases, the amount of spectra and data become increasingly hard to process and reconstruct. In addition, transitioning from layer-by-layer maps to the 3D space requires use of protocols for computational reconstruction. Advancement of visualization techniques and strategies for handling big data will be important in the next few years for expanding LIBS into a true 3D chemical imaging technique.

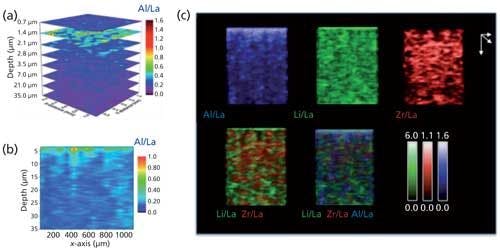
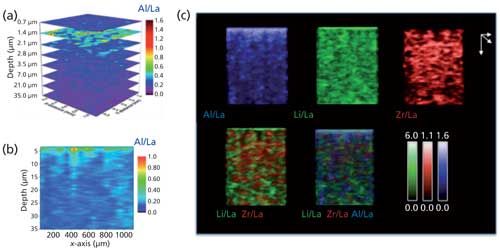
Figure 3: 2D (a) layer-by-layer and (b) cross-sectional elemental ratio for Al/La in an Al-substituted LLZO solid electrolyte matrix using femtosecond LIBS. (c) Computational conversion of the spatially resolved LIBS data allows reconstruction of the distribution of different elements and their relative ratios in 3D across different planes and viewing angles. Colors correspond to the following ratios: blue, Al/La; green, Li/La; red, Zr/La. Plots are viewed under 60-degree rotation across the horizontal axis.
The LLZO solid electrolyte material was prepared for LIBS analysis as pellets covered by fresh LLZO powder and by LLZO powder that was annealed at a high temperature for several hours. What did you learn about how your sample preparation affected your results?
We found that small variations in the sample preparation method affected the distribution of low-concentration Al and its segregation at specific locations in the material matrix. This variation in subsurface composition, along with microstructure and electrochemical parameters, resulted in a significant decrease in the sample conductivity and increase of the interfacial resistance (6). This was a very good example of how small variations in subsurface composition can really affect performance, and how important elemental imaging can be used to control fabrication processes of next-generation energy materials.
References
- V. Zorba, X. Mao, and R.E. Russo, Spectrochim. Acta, Part B66, 189 (2011).
- V. Zorba, X. Mao, and R.E. Russo, Spectrochim. Acta, Part B113, 37â42 (2015).
- Y. Lu, V. Zorba, X. Mao, R. Zheng, and R.E. Russo, J. Anal. At. Spectrom.28, 743â748 (2013).
- V. Zorba, J. Syzdek, X. Mao, R.E. Russo, and R. Kostecki, Appl. Phys. Lett.100, 234101 (2012).
- H. Hou, L. Cheng, T. Richardson, G. Chen, M. Doeff, R. Zheng, R. Russo, and V. Zorba, J. Anal. At. Spectrom. 30, 2295â2302 (2015).
- L. Cheng, J.S. Park, H. Hou, V. Zorba, G. Chen, T. Richardson, J. Cabana, R. Russo, and M. Doeff, J. Mater. Chem. A2, 172 (2014).


Newsletter
Get essential updates on the latest spectroscopy technologies, regulatory standards, and best practices—subscribe today to Spectroscopy.