Article
Special Issues
Spectroscopy Supplements
Microbial Identification Using FT-IR
The author discusses the benefits of using FT-IR to identify microbial organisms.
The rapid and accurate identification of microbial organisms is increasingly important in several critical areas of interest. For example, the identification of foodborne pathogens plays a critical role in determining the source of food poisoning, such as the recent outbreak of salmonella from tomato consumption in the United States. Many microorganisms have highly specific infrared absorption signatures and are suitable for Fourier transform–infrared (FT-IR) spectroscopic analysis. FT-IR spectroscopy can generate spectra of microorganisms without the need for extraction, amplification, labeling, or staining and can provide results in much less time than traditional identification methods. The key to success in identifying microorganisms down to the strain level with FT-IR spectroscopy is achieving excellent reproducibility in sample growth conditions, correct preparation of the biofilms, and subsequent collection of the infrared spectrum.
Foodborne pathogens such as Salmonella, Escherichia coli O157:H7, Campylobacter, and Yersinia enterocolitica are causing increasingly widespread outbreaks of illness across many states and nations. Each year, millions of people in the United States experience illness caused by a foodborne microorganism. Securing the safety of the food supply requires the ability to detect and classify contaminates before a product is placed into the food supply. Current methods of identifying microorganisms require resuscitation of pathogens using a series of nutrient media transfers beginning with nonselective enrichment media and moving to a selective medium. This technique generally takes several days to complete, so by the time a contamination has been detected, the products usually have been released to market. This long lead time can compromise public health and lead to expensive and reputation-damaging recalls that are sometimes necessary in the interest of public health (1).
There is also a growing need for rapid identification of microorganisms in patients in order to promptly prescribe the correct treatment regimen. Traditional commercially available identification systems are based on the microorganism's nutritional and physiological characteristics. A pure microbial culture and large inoculums are required to obtain results with these methods. The typical turnaround time is 1 day for completion of the process of extraction, amplification, labeling, and staining required for delivery of identification results. This delay can have adverse consequences. One study showed that mortality rates of patents who do not initially receive the correct therapy for a microbial infection is 30% to 60% higher than the group that receives the appropriate therapy promptly (2).
Development of FT-IR Spectroscopy for Microbial Identification
Fourier transform–infrared (FT-IR) spectroscopy has been used in industrial applications such as chemical and pharmaceutical manufacturing and quality control for decades to provide positive fingerprint identification of materials, but only more recently has been applied to the challenge of microbial identifications. The development of an FT-IR spectroscopy–based method for the identification of microorganisms was carried out by researchers at the Robert Koch Institute in Berlin in collaboration with Bruker Optik GmbH between 1986 and 1989. The prototype of a dedicated FT-IR system for microbial characterization was then tested by several microbial laboratories in a joint pilot study between 1992 and 1994 (3–5).
FT-IR microbial identification is based on the fact that each molecule's functional groups absorb infrared radiation to generate a characteristic absorption or transmission spectrum that is rich in information and unique to that molecule. Spectra can be analyzed or searched against libraries of reference materials to positively identify unknown materials. Just like human fingerprints uniquely identify their owner, IR spectroscopy provides a spectral fingerprint that uniquely identifies a chemical compound. In the field of microbiology, an FT-IR spectrum reveals a cell's fingerprint, which reflects its biochemical composition including proteins, lipids, DNA and RNA, and carbohydrates. The method's high sensitivity and selectivity make it possible to identify microorganisms even down to the strain level.
Sample Preparation Process
The cell material of a pure single colony is spread on an agar plate using a spatula to generate a confluent growth, as shown in Figure 1. The optimal incubation time is typically 16–24 h, and the most common growth temperature range applicable to bacteria is 35–37 °C.


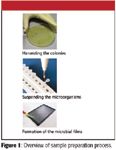
Figure 1
Sample material can be harvested directly from the middle of the cell lawn using a calibrated 1-mm diameter platinum loop. A calibrated bacterial loop should be used to avoid transferring agar. The necessary amount depends on the organism and the consistency of the colony growth, but typically corresponds to one or two full to heaping loops. The sample material should only be taken from the confluent growth regions of the colonies in the third quadrant of the agar plate. This technique captures a mixture of cells in a very reproducible mixture of different growth phases. The material is transferred and suspended in water in the reaction vessel to create a homogenous biofilm. Normally, shaking the reaction vial is sufficient to suspend the bacteria, but in some cases a vortex or even weak ultrasonic treatment might be necessary.
An aliquot of the suspension is then transferred to the sample position of the microplate with a pipette and dried to a biofilm for the final measurement. The suspension should be placed to cover the sampling region completely so that the infrared beam cannot penetrate the sampling area without passing through the sample. The sample is placed over silica gel or Siccapent inside a closed desiccator at 40 °C. A vacuum of 4–7 kPa (30–50 Torr or 40–70 millibar) is applied for 10–20 min depending on the number of samples and the condition of the desiccant to dry the sample to a transparent bacteria film. The desiccator should be vented not more than 5 min after the last sample is dry to prevent the sample films from tearing. Testing might be necessary to determine drying conditions that can provide high spectral quality.
The cuvette can then be loaded into the spectrometer sample compartment. Typical analysis takes about 15 s.
Data Analysis
The evaluation of the microorganism spectra should be undertaken using the first derivative of the resulting spectra. Broad overlapping bands characteristic of microorganism spectra become better resolved by taking the first derivative, as shown in Figure 2. Taking the first derivative of the spectra also provides a simple baseline correction. The intensity of the bands in the first derivative spectra is approximately 100 times smaller than in the original spectra. Measured spectra can be evaluated using either cluster analysis or an identity test report.

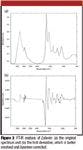
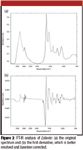
Figure 2
Cluster analysis helps identify similarities between the spectra of microorganisms under analysis and the spectra of known species and can be most useful for differentiating spectroscopically similar strains. The wavenumber regions, weighting factors, and mathematical methods used for cluster analysis must be specified. Two very popular cluster analysis algorithms for microbial identification are average linkage and Ward's algorithm. A dendrogram is a tree diagram frequently used to illustrate the arrangement of the clusters produced by a clustering algorithm. In the average linkage method, the fusion values in the dendrogram correspond at least approximately to the original distance values in the spectra, making the dendrograms relatively easy to interpret, as illustrated in Figure 3.

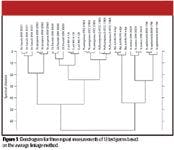
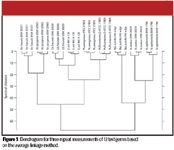
Figure 3
Development of Spectral Libraries
Established and reliable reference techniques have been used to develop spectral libraries of microorganisms. These libraries are important for the identification and classification of microorganisms. The following procedure can be used to create a library with fixed wavenumber ranges. Repeat measurements are carried out over time of independently prepared strains of the sample cultivated under identical conditions in different batches of the same medium. A valid spectral database should cover a high number of different species with a high number of reference strains for each species. The composition should be well balanced, and all reference strains should be identified carefully by independent methods.
The strain typical spectra are partitioned randomly into two approximately equal size data sets — the original data set and the test data set. The re-identification rate (the percentage of the test data set correctly identified at the strain level) is calculated based on each wavenumber region, one at a time using the original data set as the library and the test data set as samples. The six wavenumber ranges shown in Table I have proven to be particularly useful for the identification of microorganisms. These frequency ranges have been selected based on the empirical values of selected organism groups. For other organisms, different regions might have superior predictive value.

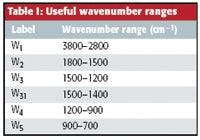
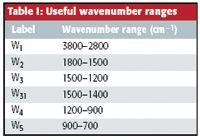
Table I: Useful wavenumber ranges
The wavenumber ranges are selected to minimize the number of incorrectly identified spectra. They are put together in combinations with each range having a weighting of the re-identification rate. These combinations of wavenumber domains are tested, and the optimal combinations are selected for the spectral library. The entire procedure is repeated for validation purposes, except that the original data set and the test data set are interchanged. Finally, the spectral library is tested on a data set of spectra collected from microorganisms not included in either test set to ensure that no systemic errors have been introduced.
Strains should be organized into sensible classes such as species, genus, or other systematic grouping, so that unknown species can be clearly assigned to a known group. An automated process can then compare the spectrum of an unknown microorganism against all of the spectra in a library. This process can incorporate the specific wavelength range used, weighting factors and mathematical techniques. Identification results are summarized in table format showing the identified strain or species. Additionally, each sample has a detailed hit list. Statistical methods are used to express the probability that the identification is correct and determine the specific limit values for each group. The reporting of the identification probability is required under GMP and GLP guidelines. Each measurement of known strains increases the reference database, which in turn increases the precision of the determination of the individual microorganisms.
In the dendrogram shown in Figure 4, the spectrum of the unknown bacterium shows high similarity to the Pseudomonas spectra. The small values for hit quality for the two Pseudomonas species in the reference database confirm the identification as a Pseudomonas strain. The hit quality value for P. fluorescens is below the threshold value for this group. This indicates that the unknown strain belongs to the P. fluorescens species. The spectra should be compared to a database that contains only spectra of Psuedomonas strains to identify the strain.

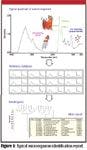
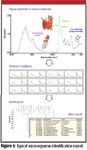
Figure 4
Conclusion
FT-IR spectroscopy is a whole-cell fingerprinting technique that provides high sensitivity, subspecies specificity, and applicability to all microorganisms. Further, it can be used to identify and classify microorganisms by genus, species, and strain utilizing the well-established mathematical methods of cluster analysis and quantitative searching of reference data sets. The FT-IR analysis can be automated and has low associated consumable costs. The mean time for identification and classification is about three times shorter than currently used methods, which can have an important effect on early detection and management of an outbreak of potentially hazardous microorganisms.
Tom Tague is Applications Manager with Bruker Optics, Inc., Billerica, Massachusetts.
References
(1) R.V. Tauxe, Emerg. Infect. Dis. 3(4), 425–434 1997.
(2) E.H. Ibrahim, G. Sherman, S. Ward, V.J. Fraser, and M.H. Kollef, Chest 118, 146–155 (2000).
(3) D. Naumann, D. Helm, and H. Labischinski, Nature 351, 81–82 (1991).
(4) D. Helm, H. Labischinski, G. Schallen, and D. Naumann, J. Gen. Microbiol. 137, 69 (1991).
(5) D. Helm, H. Labischinski, and D. Naumann, J. Microbiol. Methods 14, 127–142 (1991).


Newsletter
Get essential updates on the latest spectroscopy technologies, regulatory standards, and best practices—subscribe today to Spectroscopy.


