Article
Special Issues
Spectroscopy Supplements
Miniaturized MIR and NIR Sensors for Medicinal Plant Quality Control
Author(s):
This work shows that methods based on miniaturized near- and mid-infrared spectroscopy can be used effectively for the quality control of herbal medicines.
The trend in analytical method development follows two different strategies. One is the further improvement of spectrometers toward higher performance; the other is to develop small, portable, and relatively cheap instruments that can be easily used by anyone. Today, small near-infrared (NIR) sensors are either based on microelectromechanical systems (MEMS) or linear variable tunable filters (LVTF) for appropriate wavelength selection. For measurement in the mid-infrared (MIR) region, handheld attenuated total reflection (ATR) spectrometers give great promise based on the improved signal-to-noise ratio enabled by the evanescent field principle. Both instrumental technologies can be used to monitor quality and determine the ideal harvest time of medicinal plants, such as Verbena officinalis and Rosmarini folium. For method development, quantum chemistry for band assignment and two-dimensional correlation spectroscopy for a better understanding of the factors that determine the partial least squares (PLS) regression models can be conducted. From these studies it can be shown that the performance of NIR and MIR spectroscopy with miniaturized devices as a fast and noninvasive technique is able to replace time- and resource-consuming analytical tools, being of high interest for the continuous growing phytopharmaceutical industry and its quality control.
Infrared (IR) is divided into near-infrared (NIR, 750–2500 nm, 4000–13,000 cm-1) (1), mid-infrared (MIR, 2500–25,000 nm, 400–4000 cm-1) (2), and far-infrared (25,000–106 nm, 400–10 cm-1) (3) subregions, from which mainly NIR and MIR are applied to medicinal plant analysis (4). NIR spectroscopy is concerned with the absorption, emission, reflection, and diffuse reflection of light; it is electronic as well as vibrational spectroscopy dealing with overtones and combination modes following the model of the anharmonic oscillator. MIR is vibrational spectroscopy dealing with fundamental modes following the harmonic oscillator principle, and in comparison, NIR spectra are usually crowded containing manifold information extracted from overlapping peaks with NIR intensities that are 10–1000 times lower (5). The further development of portable and handheld NIR spectrometers based on microelectromechanical systems (MEMS) (6) and linear variable tunable filters (LVTF) (7) is making NIR spectroscopy very popular. Attenuated total reflection (ATR) is the most suitable form of applying MIR spectroscopy, benefiting from the evanescent field and penetrating at least a few micrometers into the sample of interest providing high signal-to-noise ratio (S/N) (8). Two-dimensional (2D) spectroscopy, first proposed by Noda in the 1980s (9), has been further developed (10) to be applied for quality control in food and agricultural products (11). Defined by two independent spectral axes, the 2D correlation spectrum is generated by applying correlation analysis to the dynamic fluctuations of spectral signals caused by external perturbations, for example, chemical, thermal, or mechanical stimulations. One notable feature of 2D correlation spectroscopy (2D-COS) is that the cross-peaks can potentially be used to characterize intermolecular interactions. The advent of 2D-COS brings about a new avenue for the investigation of intermolecular interactions.
In many applications it is impossible to correctly assign the corresponding vibration bands. Quantum chemical calculations are a great method for band assignment not only in the MIR, but also in the NIR region (12). Vibrational spectroscopy with multivariate statistical analysis (MVA) is a powerful, synergistic combination enabling the extraction of the required information from the spectrum in the first step (13,14). Clustering methods such as principal component analysis (PCA), hierarchical cluster analysis (HCA), fuzzy-C-means clustering, and others enable the reduction of the number of variables enabling qualitative analysis (15). For the establishment of quantitative regression models, partial least square regression (PLSR) (16) is the preferred method, correlating spectral data with those obtained from reference methods such as liquid chromatography (LC) (17) and LC–mass spectrometry (MS) (18), solid-phase extraction (SPE) (19,20), gas chromatography (GC) (21), capillary electrophoresis (CE) (22), capillary electrochromatography (CEC) (23), and MS (24).
In this article, the potent combination of these methodologies as a novel strategy in medicinal plant analysis is introduced and summarized for the highly efficient quality control of Verbena officinalis (25) and Rosmarini folium (26), two typical plants used in folk medicine.
Methods
NIR Spectroscopy
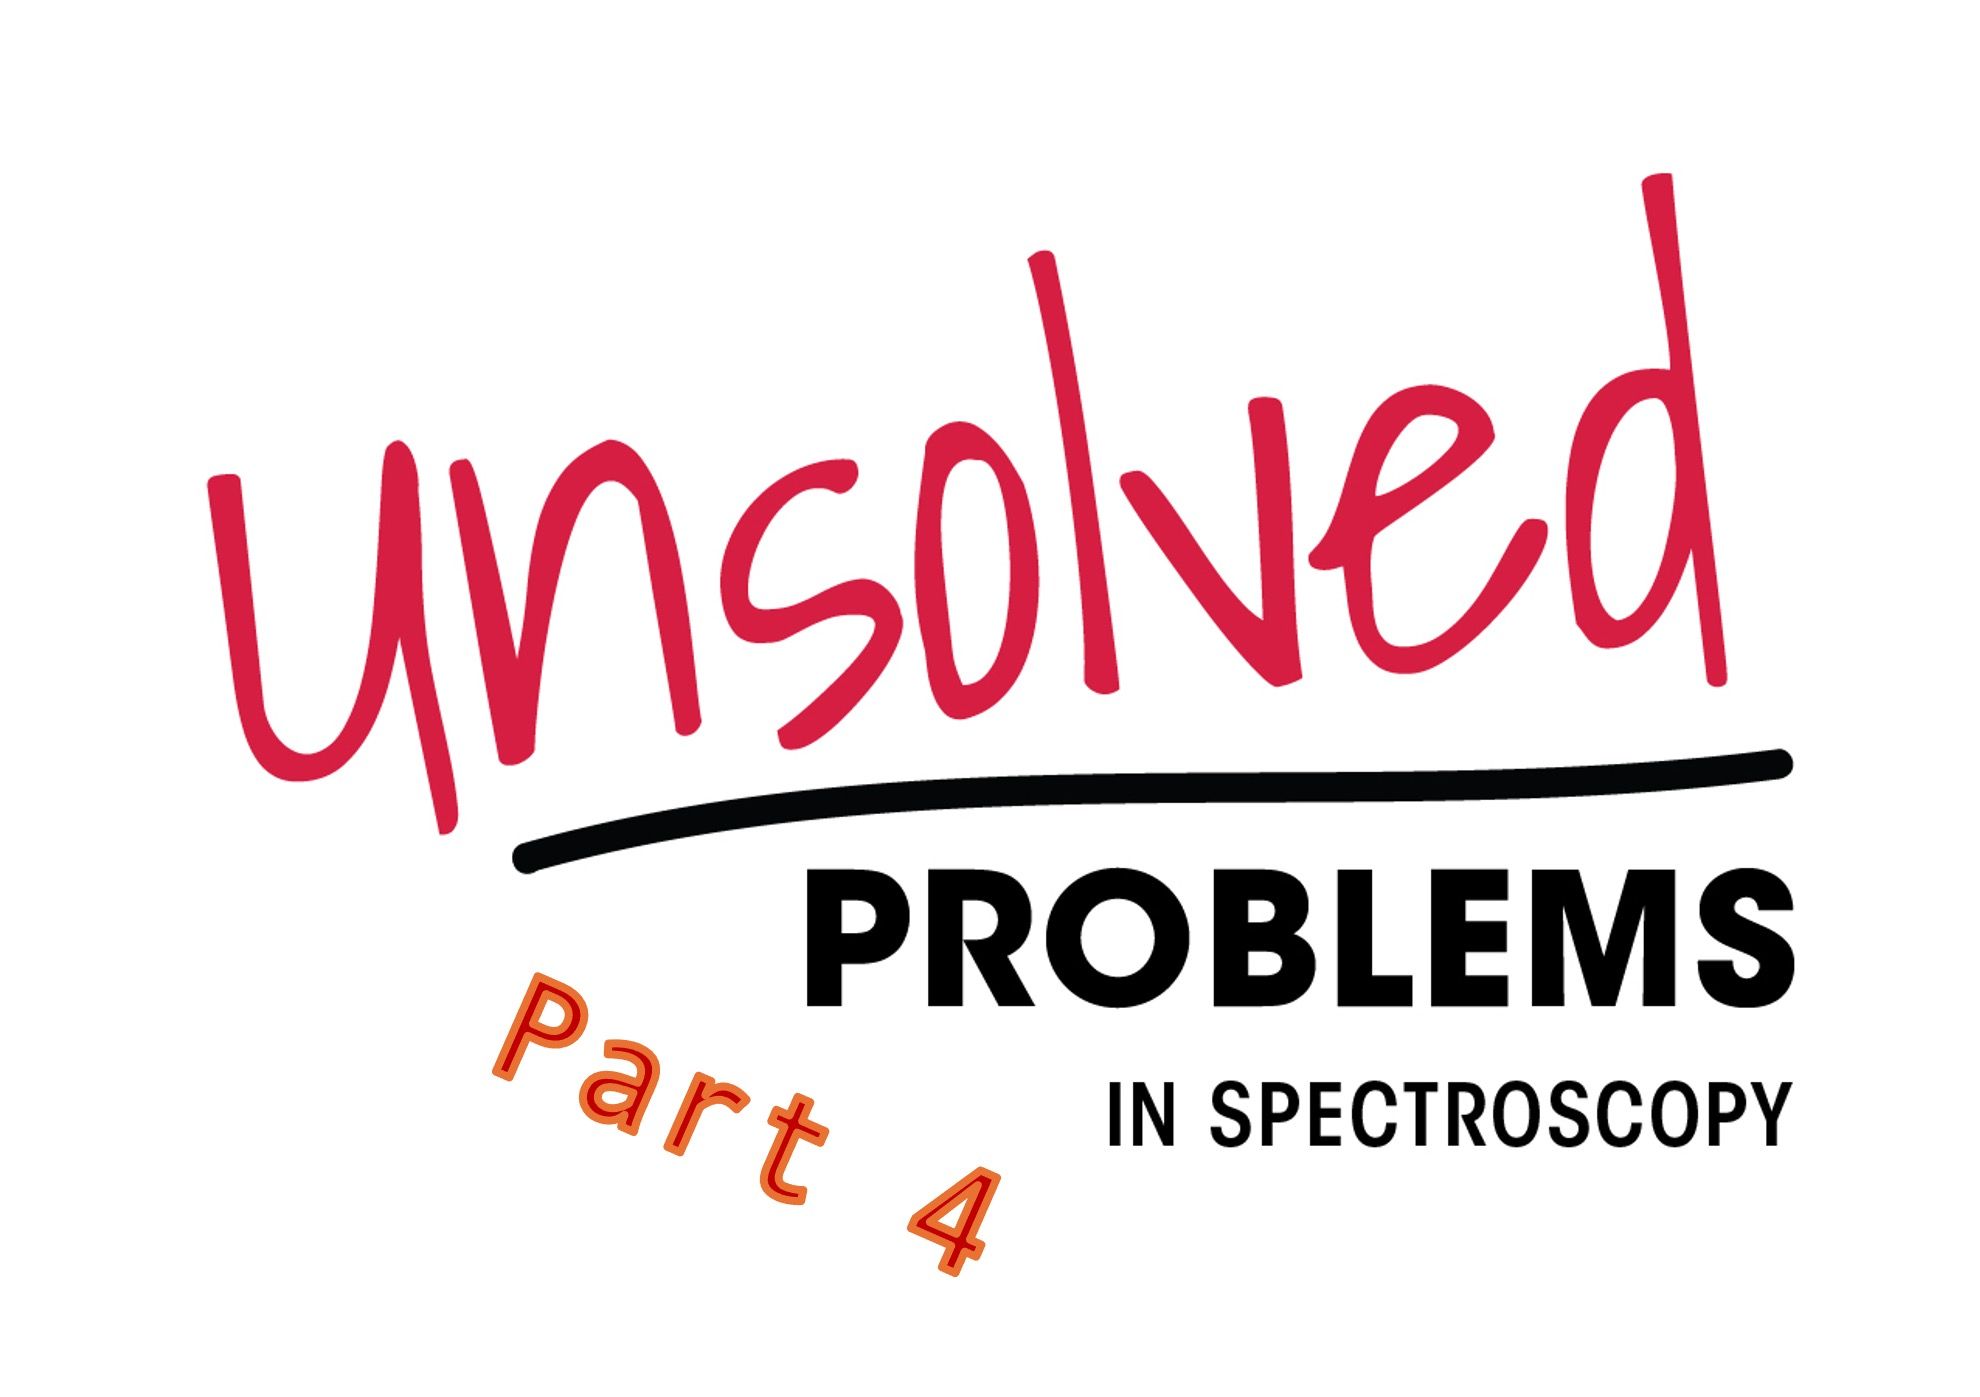
The inexorable trend toward the miniaturization of spectrometers has been continuing since the 1970s. The development of one of the smallest NIR spectrometers, with a current weight of only 60 g, was enabled by introducing MEMS in 2008 (Figure 1a) and LVTF in 2012 (Figure 1b) (27,28). A MEMS device is made up of components 1–100 µm in size, and it generally ranges in size from 20 µm to 1 mm (29). The active circuit contains upper and lower mirrors acting as wavelength-tunable parallel plates: The width of the air gap controls the resonant frequency of the cavity and allows certain wavelengths to pass. The upper mirror’s movement is controlled through an applied voltage. Applying different voltages results in transmitting a spectrum of wavelengths to be detected by the InGaAs PIN photodiode (30). This technology was added to smartphones in 2014; remote systems using wireless hyphenation to smart computers were created in 2016 (31).

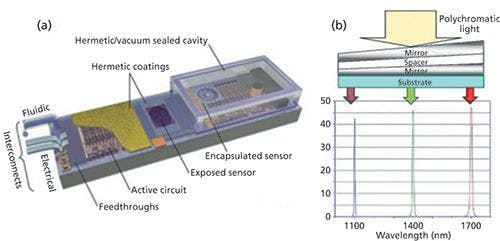
Figure 1: Schematics showing (a) microelectromechanical system (MEMS) and (b) linear variable tunable filter (LVTF) construction.
LVTF are small-wedged Fabry-Perot etalons manufactured in a thin-film optical coating process. The bottom layer is made of several Bragg reflectors forming a dielectric mirror. The next layer forms the cavity of the resonator. Atop this resonator, a second layer of Bragg reflectors is applied as the upper dielectric mirror (7,32,33).
2D-COS
This method offers a higher resolution where even strongly overlapping peaks can be distinguished and explicitly assigned (9). Applying a second dimension enables the interpretation of the sequential order of intensity change and offers the possibility of correlating different spectroscopic methods via hetero-spectroscopic correlation. For the generation of the needed dynamic data sets of spectra an external perturbation, such as temperature, time, or pressure, should be applied during the IR measurements. The following correlation analysis generates a synchronous and an asynchronous 2D spectrum (10). While the synchronous spectrum features so-called auto-peaks along the diagonal and the sign of its cross-peaks indicates a rise or fall in intensity, the asynchronous spectrum lacks in auto-peaks, but its cross-peaks provide the information of the sequential order of the intensity change.
Quantum Chemical Calculations
The generalized second-order vibrational perturbation (GVPT2) theory approach on a density functional theory (DFT) level for the calculation of the NIR spectrum was used, with the aim of obtaining a better explanation of the observed experimental patterns. For small molecules in a diluted phase this theoretical approach gives excellent results (37).
Results and Discussion
Application of Benchtop and Portable NIR for Predicting the Optimum Harvest Time of Verbena officinalis
The applicability of NIR spectroscopy to determine the ideal harvest time of Verbena officinalis was demonstrated (25). As a reference method a novel high performance liquid chromatography–diode array detection–electrospray ionization-mass spectrometry (HPLC–DAD–ESI-MS) method was developed and validated. HPLC analysis of the leaf drug showed that the content of the quality-determining compound verbenalin fluctuated throughout the flowering period. Verbascoside as a further pharmacologically important ingredient increased from the middle of flowering, but was also subjected to certain variations. The causes of these fluctuations can have various reasons, such as insolation, humidity, fertilization, and soil condition. For these reasons, the development of a quick and noninvasive NIR method was essential for the determination of the optimum time to harvest Verbena officinalis.
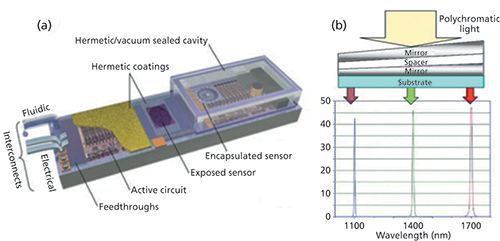
PLS regression results obtained from the benchtop polarization interferometer-based FT-NIR spectrometer demonstrated that NIR spectroscopy is suitable for the characterization of Verbena officinalis (see Table I). PLS results of cross and test-set validation models for verbenalin and verbascoside reached R2 values ranging from 0.82 to 0.85. A maximum of five latent variables (LVs) was needed. The standard error of prediction–standard error of calibration (SEP–SEC) quotient achieved values near to 1 (0.8–1.2) attesting to the robustness of the developed models. The residual predictive deviation (RPD) was >2, confirming a satisfactory quality. A quick and simple determination of the ideal time to harvest Verbena officinalis was possible.

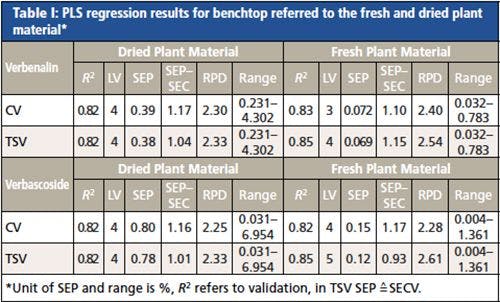
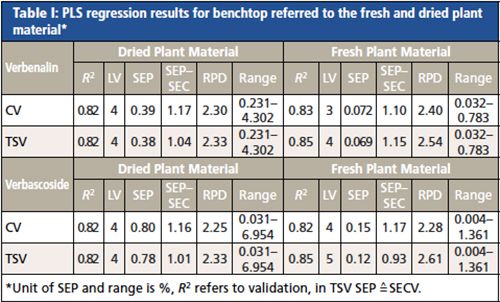
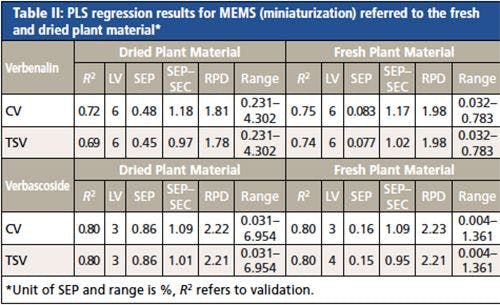
To allow a laboratory-independent applicability of the NIR analysis, the portable MEMS was evaluated for its performance. Regression results for verbascoside (see Table II) reached an R2 of 0.8. A maximum of four LVs was required. The SEPÂSEC ratio ranged between 0.95–1.09 and the RPD values from 2.21–2.23, which indicate the robustness and quality of the developed PLS models. The results of this study clearly revealed that the prediction of verbascoside applying the portable device could be performed with nearly the same accuracy as with the benchtop spectrometer. PLS models for verbenalin were less precise showing a value for R2 between 0.69 and 0.75 and RPD values < 2. Therefore, the quality of the calibration using the handheld device was not satisfactory. Reproducible quantifications of verbenalin applying NIR spectroscopy are quite feasible as the aforementioned study using the benchtop device has shown. The low resolution and the limited spectral range of the mobile NIR device seem to be the responsible spectral features necessary for a successful quantification of verbenalin that were not sufficiently captured. Therefore, the application of a portable spectrometer with a different spectral range and higher resolution may lead to further improved calibration models.

Evaluation of Spectral Information of Benchtop Versus Portable Spectrometers for the Quality Control of Rosmarini folium
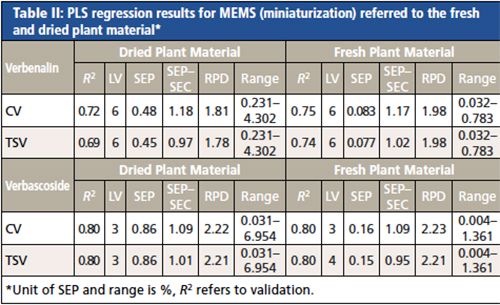
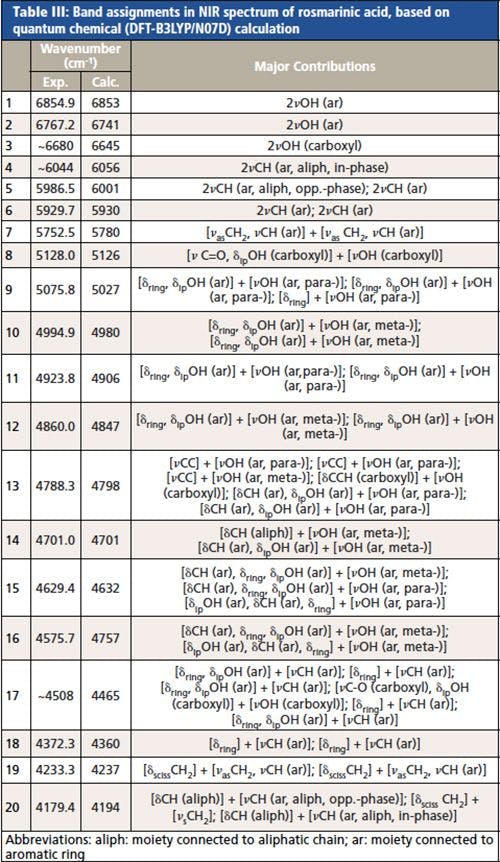
The theoretical NIR spectrum of rosmarinic acid (RA) allowed a detailed band assignment for the molecule throughout the NIR region (8000–4000 cm-1), which is presented in Table III (26).

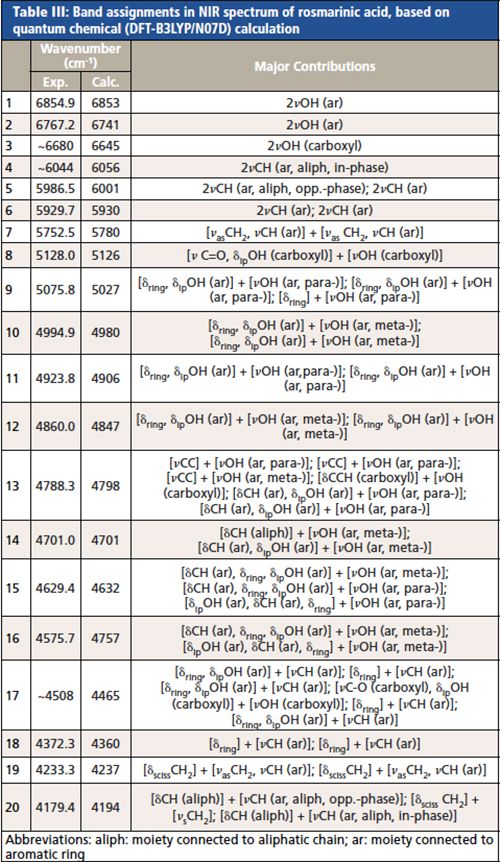
CLICK TABLE TO ENLARGE
For the comparison of benchtop, MEMS, and LVTF devices, the measured spectra of Rosmarini folium were investigated by syn 2D-COS plot using MSC pretreated spectra. Figure 2a shows the syn spectrum of the entire range of the benchtop FT-NIR system (NIRFlex N-500, Buchi Corp.), which is compared to the spectrum of the MEMS system (microPHASIR, Thermo Fisher Scientific) in Figure 2b. The major discrepancies are the peaks at 4678 cm-1 (region of appearance of δCH+νOH bands of RA) and 4785 cm-1 (νCC+νOH[ar], δCH+νOH [carboxyl], δCH[ar]+νOH[ar]) that appear in the 2D plot of the miniaturized device. Although these bands are unnecessary for the benchtop-based analysis, it is a crucial region for the calculation of an expedient PLS regression model for MEMS. Between 5600 and 6000 cm-1 (δCH+νOH [carboxyl] and νasCH2+νasCH2), two peaks in the spectrum of the benchtop system are accompanied by one peak of the MEMS device. The conclusion of no further significant differences can be supported by the application of a hetero-2D-correlation between the spectra of the benchtop (x-axis) and the MEMS device (y-axis) (Figure 2f). By comparing the benchtop device (Figure 2a) with the LVTF system (MicroNIR 2200, Viavi Solutions) (Figure 2c), the significant differences are identified as the negative crosspeaks of the LVTF system in the range between 5400 to 7300 cm-1 (2νOH[ar and carboxyl], 2νCH, νasCH2+νasCH2) that appears positive in the 2D benchtop system spectrum. If this result is investigated with a hetero-2D-correlation, these opposite signs are shown in the resultant spectrum as well (Figure 2e). Hence, the negative crosspeak in the mentioned range of the LVTF system at the y-axis signals a contrary behavior to the crosspeak of the benchtop device at the x-axis. In accordance with the homo-2D-correlation, the hetero-2D-correlation shows no other difference between the two devices.


Figure 2: 2D spectra obtained using (a) a benchtop system (NIRFlex N-500), (b) a MEMS-based system (microPHAZIR), (c) an LVTF system (MicroNIR 2200) with the pretreatment of the moving average transform, (d) an LVTF system without the pretreatment of the moving average transform, (e) hetero-correlation between the benchtop system (x-axis) and the LVTF system (y-axis), and (f) heterocorrelation between the benchtop (x-axis) and MEMS (y-axis) systems. The x- and y-axes are wavenumbers (cm-1).
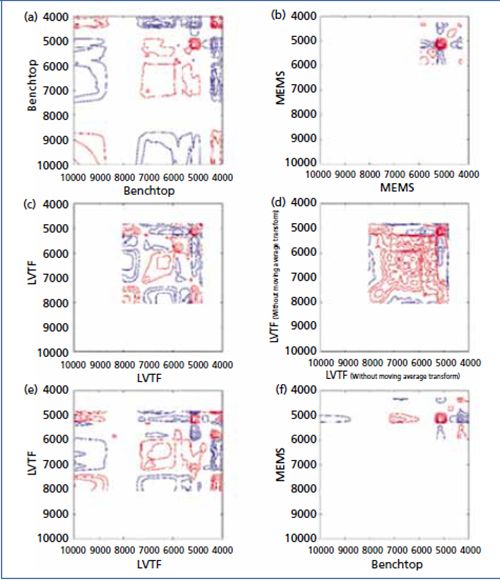
In Figure 2d the 2D spectrum without moving average transform is illustrated, while Figure 2c includes the pretreatment. This shows that 2D-correlation provides an explanation about why moving average transform was a necessity for an improved PLS model calculation.
The results of the PLS regression models were ranked because of RPD and R2, respectively, evaluated by coefficient of variation (CV) (see Table IV). The best NIR-PLS regression model was achieved by the benchtop NIR spectrometer (RPD = 3.27; R2 = 0.91), which covered the widest spectral range (10,000–4000 cm-1) with the highest resolution (âν = 8 cm-1) compared to the other two NIR devices. The miniaturized LVTF NIR spectrometer was the second best (RPD = 2.46; R2 = 0.84), performing satisfactorily. The performance of the miniaturized MEMS NIR spectrometer (RPD = 1.88; R2 = 0.73) can be improved.

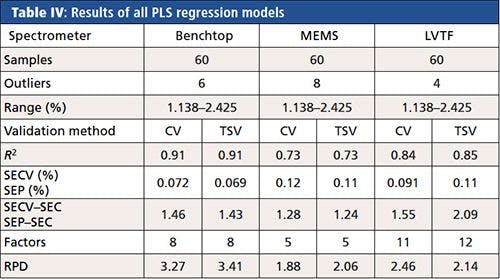
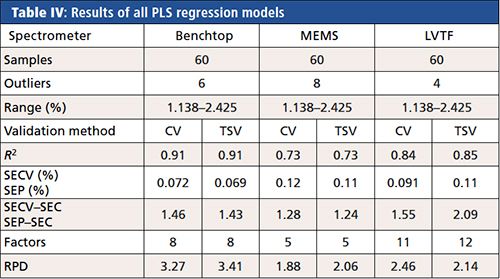
CLICK TABLE TO ENLARGE
Conclusions
Miniaturized spectrometers show great promise for quality control in the phytopharmaceutical industry. The evaluation of the results leads to the conclusion that it is necessary to prove the applicability of NIR devices in dependence on recording wavenumber ranges and resolution.
References
- W.F. McClure, J. Near Infrared Spectrosc.11, 487–518 (2004).
- J.M. Chalmers and P.R. Griffiths, Handbook of Vibrational Spectroscopy (J. Wiley, Hoboken, New Jersey, 2002).
- P.R. Griffiths and C.C. Homes in Handbook of Vibrational Spectroscopy, P.R. Griffiths, Ed. (John Wiley & Sons, Ltd., Chichester, UK, 2006).
- C.W. Huck, Phytochem.Lett.11, 384–393 (2015).
- O.M.D. Lutz, G.K. Bonn, B.M. Rode, and C.W. Huck, Anal. Chim.Acta826, 61–68 (2014).
- L.P. Schuler et al., J. Phys. D. Appl. Phys.42, 133001 (2009).
- D.L. Wetzel, A.J. Eilert, and J.A. Sweat, in Handbook of Vibrational Spectroscopy, P.R. Griffiths, Ed. (John Wiley & Sons, Ltd., Chichester, UK, 2006).
- S.A. Schönbichler, G.F. Falser, S. Hussain, L. Bittner, G. Abel, M. Popp, G.K. Bonn, and C. Huck, Anal. Methods6, 6343–6351 (2014).
- Y. Ozaki and I. Noda, J. Near Infrared Spectrosc.4, 85 (1996).
- X. Li, Q. Pan, J. Chen, S. Liu, A. He, C. Liu, Y. Wei, K. Huang, L. Yang, J. Feng, Y. Zhao, Y. Xu, Y. Ozaki, I. Noda, and J. Wu, Appl. Spectrosc.65, 901–917 (2011).
- A.L. Fudge, K.L. Wilkinson, R. Ristic, and D. Cozzolino, Food Chem.139, 115–119 (2013).
- C.G. Kirchler, C.K. Pezzei, K.B. Bec, S. Mayr, M. Ishigaki, Y. Ozaki, and C.W. Huck, Analyst142, 455–464 (2017).
- M. Blanco and I. Villarroya, TrAC Trends Anal. Chem.21, 240–250 (2002).
- W. Kessler and R.W. Kessler, Anal. Bioanal. Chem.384, 1087–1095 (2006).
- C.W. Huck, and V.A. Huck-Pezzei, Multidimensional Approach of Infrared Imaging Spectra and Morphology of Oral Squamous Cell Carcinoma (OSCC) (Nova Science Publishers, Hauppauge, New York, 2014).
- C.H. Petter, N, Heigl, R. Bakry, G.K. Bonn, A. Ritsch, and C.W. Huck Curr. Med. Chem. 16, 8 (2009).
- C.W. Huck, C.G. Huber, I.M. Lagoja, K.-H. Ongania, H. Scherz, G.K. Bonn, and M. Popp, Planta Med.65, 491 (1999).
- W. Stöggl, C. Huck, S. Wongyai, H. Scherz, and G. Bonn, J. Sep. Sci.28, 1712–1718 (2005).
- C. Huck, Molecules21, 633 (2016).
- C.W. Huck and G.K. Bonn, J. Chromatogr. A885, 51–72 (2000).
- S.M. Valtiner, G.K. Bonn, and C.W. Huck, Phytochem. Anal.19, 359–367 (2008).
- C.W. Huck, G. Stecher, W. Ahrer, W.M. Stöggl, W. Buchberger, and G.K. Bonn, J. Sep. Sci.25, 903–908 (2002).
- W.M. Stöggl, C.W. Huck, G. Stecher, and G.K. Bonn, Electrophoresis27, 787–792 (2006).
- M. Najam-ul-Haq, M. Rainer, T. Schwarzenauer, C.W. Huck, and G.K. Bonn, Anal. Chim. Acta561, 32–39 (2006).
- C.K. Pezzei, S.A. Schönbichler, C.G. Kirchler, J. Schmelzer, S. Hussain, V.A. Huck-Pezzei, M. Popp, J. Krolitzek, G.K. Bonn, and C.W. Huck, Talanta169, 70–76 (2017). Available from: http://www.sciencedirect.com/science/article/pii/S0039914017303636.
- C.G. Kirchler, C.K. Pezzei, K.B. Be, S. Mayr, M. Ishigaki, Y. Ozaki, and C.W. Huck, Analyst 8374, 837404 (2016).
- D. Sorak, L. Herberholz, S. Iwascek, S. Altinpinar, F. Pfeifer, and H.W. Siesler, Appl. Spectrosc. Rev.47, 83-–115 (2012).
- C.W. Huck, GIT Lab J.29, 2–5 (2016).J. Antila, M. Tuohiniemi, A. Rissanen, U. Kantojärvi, M. Lahti, K. Viherkanto, M. Kaarre, J. Malinen, J. Antila, M. Tuohiniemi, A. Rissanen, U. Kantojärvi, M. Lahti, K. Viherkanto, M. Kaarre, and J. Malinen, in Encyclopedia of Analytical Chemistry (John Wiley & Sons, Ltd., Chichester, UK, 2000), pp. 1–36.
- T. Egloff, J. Knobbe, S. Sinzinger, and H. Grüger, Appl. Opt.48, 6583 (2009).
- Anonymous, “The Scientist and the Smartphone” Nat. Methods7, 87 (2010).
- P.D. Atherton, N.K. Reay, J. Ring, and T.R. Hicks, Opt. Eng.20, 206805–206805 (1981).
- N.A. O’Brien, C.A. Hulse, D.M. Friedrich, F.J. Van Milligen, M.K. von Gunten, F. Pfeifer, and H.W. Siesler, in Proceedings of SPIE, M.A. Druy and R.A. Crocombe, Eds., 837404 (2012).
- D.P. Aykas et al., Anal. Methods8, 731–741 (2016).
- G. Gudi, A. Krähmer, H. Krüger, and H. Schulz, Julius-Kühn-Archiv.0, 143 (2016).
- A. Cooke, M.J. Cork, S. Victor, M. Campbell, S. Danby, J. Chittock, and T. Lavender, Acta Derm. Venereol96, 323–330 (2015).
- K.B. Be, J. Grabska, C.W. Huck, Y. Ozaki, and J.P. Hawranek, J. Mol. Liq.224, 1189–1198 (2016). Available from: http://linkinghub.elsevier.com/retrieve/pii/S016773221632387X.
Christian W. Huck is with the Institute of Analytical Chemistry and Radiochemistry, CCB - Center for Chemistry and Biomedicine in Innsbruck, Austria. Direct correspondence to: Christian.W.Huck@uibk.ac.at


Newsletter
Get essential updates on the latest spectroscopy technologies, regulatory standards, and best practices—subscribe today to Spectroscopy.