Article
Special Issues
Spectroscopy Supplements
Tracking Microplastics in the Environment via FT-IR Microscopy
Author(s):
Microplastics from clothing, abrasive action on plastics, or engineered microbeads as found in some exfoliating cosmetics are showing up in many environmental systems. FT-IR microscopy is a useful tool in the analysis of microplastics, providing visual information, particle counts, and particle identification.
Microplastics are particulates, roughly 20–1000 µm in size, originating from materials such as clothing, abrasive action on plastics, or engineered microbeads as found in some exfoliating cosmetics. The microplastics enter aquifers where the particles can be consumed by filter feeders. Microplastics are chemically stable, giving them a long lifetime in the environment and making excretion or digestion difficult. Analytically, the size and polymeric nature of microplastics makes Fourier transform infrared (FT-IR) microscopy an ideal tool for detection and identification. Standard analyses typically start with a filtration step, extracting the material from the matrix. The analysis can proceed directly on the dried filter without further sample preparation. This simplicity in both sampling and analysis enables the rapid assessment of microplastic encroachment and can assist in the development of remediation techniques. We show examples from both prepared and field samples using microattenuated total reflection (ATR) FT-IR.
Macroscopic plastics are showing up in many environmental systems, including mid-Pacific zones (1) and tropical islands (2). Microplastics, 20–1000 (or 5000) µm fibers or granules of polymer, are more insidious because they can’t be picked up simply as trash. Microplastics originate both from engineered materials, such as the microbeads found in some exfoliating creams, and from abrasion or wear of polymeric materials, even from laundering of synthetic fabrics (3). Microplastics live a long time in the environment and unfortunately they are exactly the right size for filter feeders to consume them. From there, they can move up the food chain and are now found in fish, birds, and other wildlife.
The microplastic materials are small enough to be highly mobile in the environment, carried most easily by flowing water. Adsorption of chemical or biological toxins on the microplastics can then enable transport of those toxins from one biome to another (mobilizing materials). More directly, the microplastics clog critical digestive pathways. The chemical environments in the digestive paths are insufficient to dissolve these clogs, resulting in incapacitation or death of the organisms (3,4).
Remediation requires answering two critical questions: What are the particles and how many particles are present (number density)? Polyethylene, polypropylene, polystyrene, and nylon are some of the more commonly found materials, from food packing, toys, and many other sources. The number density varies from negligible in isolated lakes and streams to severe in some lakes and estuaries. Changes in the microplastic population (type or number) indicate a new set of conditions, such as those generated by flooding which augments transport of these materials over a large area.
In the aquifer, simple filtration (sieves or simple filters) is typically sufficient to isolate representative populations of microplastics. Sampling within an organism requires separation of the microplastics from the organism, such as the digestive tract of fish (4). This generates a solution that is then filtered. Observation of these samples under a standard light microscope can lead to particle counts, but identification of the materials using visible microscopy alone is problematic at best. Microplastics have been analyzed by gas chromatography–mass spectrometry (GC–MS), scanning electron microscopy with energy dispersive spectroscopy (SEM–EDS), and combustion analysis. Each of these techniques has strengths and weaknesses-sensitivity, specificity, time for analysis, and destruction of the sample being considerations. However, vibrational spectroscopy, both Fourier transform infrared (FT-IR) and Raman, can provide insights quickly and nondestructively with a high degree of confidence.
FT-IR microscopy is an excellent tool for the analysis of these materials. Filtration of a known volume of liquid (river water, for instance) followed by infrared identification and particle counting provides a thorough picture of the material present. Modern software automates many of the steps, enabling an analyst to answer those critical questions quickly and efficiently. This article starts with the basics of sample collection and single-particle identification and then examines techniques for the analysis of larger regions. We present data from both model systems using manufactured microbeads and real world filtrates.
Experimental
Samples prepared from both reference materials and environmental sources were examined. The primary goal of the work was to demonstrate the utility of FT-IR for this analysis; no extrapolation in a particular environment was made. Recently, we examined samples from the automotive, food, and cosmetics industries as well as environmental samples; here only a brief overview is provided.
Single particles were targeted and analyzed using the Thermo Scientific Nicolet iN5 FT-IR microscope, a point-and-shoot, small frame, manually operated FT-IR microscope. Larger images and a particle analysis were carried out on the automated Thermo Scientific Nicolet iN10 FT-IR microscope with OMNIC Picta software. Both microscopes used a single element MCT-A liquid-nitrogen-cooled detector for speed, although a room temperature detector would be sufficient for the point and shoot studies. All data shown in this paper were collected using germanium-attenuated total reflection (Ge-ATR) modes, though we have successfully used both reflection and transmission in other studies. Identifications were made using commercial libraries and standard searching or the OMNIC Specta multicomponent search.
Results and Discussion
Most environmental studies of microplastics involve filtration of a liquid sample (typically but not always aqueous), followed by drying. This results in a sample that can be placed directly into the microscope-there is no need to pick off pieces for analysis. The visible capabilities of FT-IR microscopes enable location and selection of a particle or a region for analysis.
Four point-and-shoot examples are shown in Figures 1–3. The fiber or particle was located visually and then centered in the aperture. The Ge-ATR accessory was then brought into contact with the particle. With Ge-ATR, there is a fourfold increase in magnification (because of its high index of refraction). The FT-IR microscope has a 10× magnification; with the Ge-ATR accessory the magnification increases to 40×. The standard 1-mm circular pinhole thus results in an effective aperture at the sample of 25 µm. As most microplastics are this size or larger, this ensures good spectral purity.
The fiber in Figure 1 was filtered from a river sample. The spectrum matches with acrylic (the strong nitrile peak at 2243 cm-1 because of -C≡N is strongly indicative of this), suggesting a fabric source as the likely origin. The two particles in Figure 2 were separated from another (different origin) water sample. Again, the ATR results are unambiguous, with the identification as polyethylene and polypropylene, respectively. These are common from many sources. Excluding sample preparation time, the analysis of these three samples took less than 2 min each even with a user not trained in microscopy.

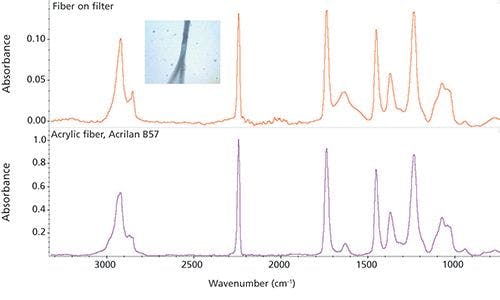
Figure 1: Fiber on filter from a river water sample. The top spectrum was collected (Ge-ATR) directly using a Nicolet iN5 microscope; the lower spectrum is a library search result.
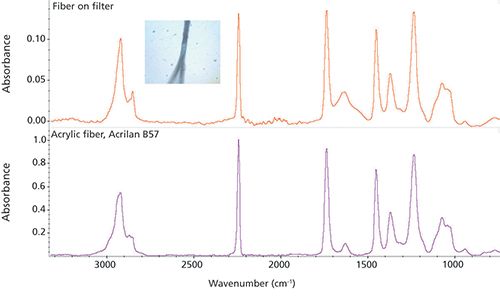

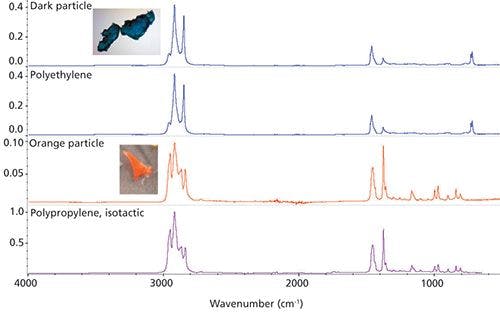
Figure 2: Two particles from water samples, again using Ge-ATR, with search results.

Microplastics circulate in the aquifer readily. This means particles from many origins can be present in a single location. Field sampling (such as sieving) results in an inhomogeneous (in size and composition) filtrate, but each particle is typically one material. This was the case in the first three examples. In contrast, single microplastic particles deriving from complex origins like in moving automobile or food processing parts may consist of multiple components. Figure 3 shows a particle filtered from shock absorber fluid and the resulting FT-IR spectrum.

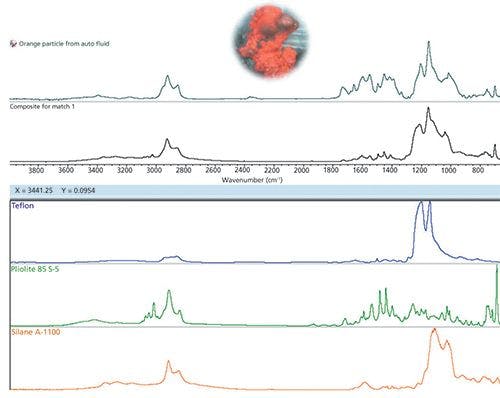
Figure 3: Particle filtered from a shock absorber. The material contains multiple components; the search result from OMNIC Specta’s multicomponent search is shown at the bottom. See text for details.

This sample shows two characteristics of many real world samples. First, it consists of several components-a mixture-meaning the software (or analyst) must combine multiple pieces of information to achieve a satisfactory result. Second, and more critically, the compounds present in the material have undergone changes because of physical, thermal, and chemical wear. These may change the molecular structure in subtle ways, causing peaks to shift and change shape. A fallacy of spectral searching is the expectation that all “good” results will give a high search metric, say 90 or 90% or 0.9, depending on the definition of the metric. The induced changes seen in materials, especially those exposed to high temperatures and strong solvents, will lower the resulting metric. In such cases, search results become indicative rather than definitive.
Such is the case here. The use of standard (single component) searching provides some clues, but this is clearly a mixture. The multicomponent searching shown in Figure 3 identified three classes of material: PTFE (the core composition of the component) along with an acrylic coating (maybe from paint) and a siloxane agent (a lubricant, most likely). The final composite search result is good but not perfect, assigning most of the peaks. Even with the discrepancies, the origin of the particle was easily tracked to a sliding joint in the device.
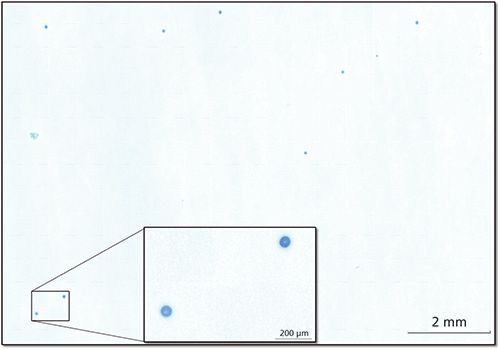
These first few examples entailed point and shoot analysis (find, target, collect, analyze). Point and shoot can be done on simple, manual FT-IR microscopes. Automation enables the analyst to obtain a wider picture-a map or image-of a sample, such as the one shown in Figure 4. For this study, a liquid suspension of standard polyethylene spheres was made and then filtered. The filter, after drying, was placed on a piece of double stick tape (to flatten and hold the filter), then inserted into an automated microscope with no further sample preparation. The visual image consists of more than 200 video captures combined into a mosaic covering approximately 1 cm2. There were 17,500 spectra collected (50 µm steps, 0.1 s/spectrum resulting in ~30 min for collection). Example spectra from the filter itself and the spheres are shown in the top of Figure 4.

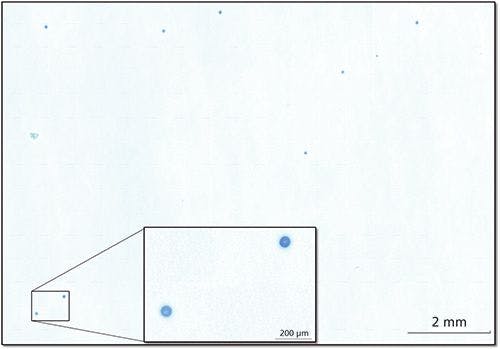
Figure 4: Visual image from filter showing particles (polyethylene beads). The image is a mosaic of over 200 individual images.
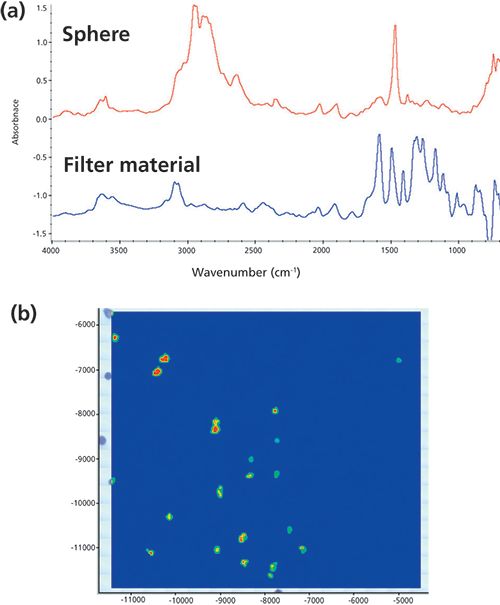
The image in Figure 5 is a correlation map relating the polyethylene spectrum from a reference standard to each spectrum in the map. Correlation highlights the presence of a component, with a value of 1 being highly correlated (very similar to the reference) and 0 being uncorrelated (not similar to the reference). In this image, the blue field is uncorrelated to polyethylene while the red spots are strongly correlated. Extension of this to the general case would use multiple curve regression (MCR) to highlight and identify each particle in an inhomogeneous population as well.

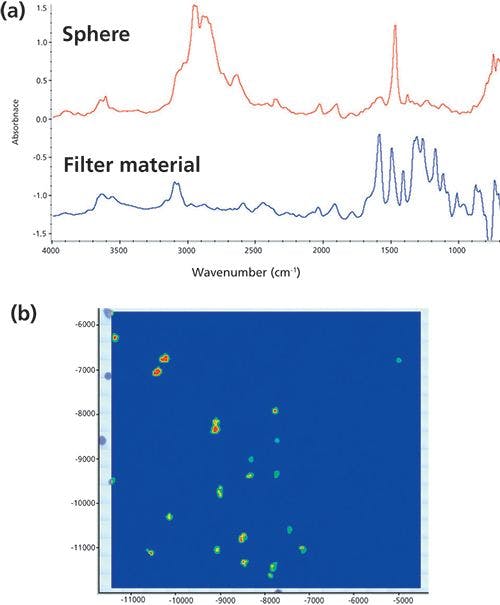
Figure 5: An IR image constructed by profiling the IR data from the sample in Figure 4. (a) Spectra of the beads and the filter paper. (b) Correlation map to the spectrum of the beads.
The FT-IR microscope’s software can complete the analysis automatically, using a particle wizard. The software allows the user to select a region from the video image. The software then identifies the target particles (which the user can filter using a size based sieve) and the analysis proceeds to produce spectra for each particle. These are then searched and a report cataloging the number of particles in the inspection area with a specific identity is prepared. Those data can then be back extrapolated through the volume of liquid filtered to provide a semiquantitative measure of the particulate concentrations.
Conclusion
Microplastics are now deeply entrenched in the food chain. Rapid, reliable measurements are needed to assist in the assessment of the problem and the potential remediation. As evidence of the presence of microplastics even in our air is becoming available, this problem will grow in importance. FT-IR, and specifically FT-IR microspectroscopy, is a useful tool in the analysis of microplastics, providing visual information, particle counts, and particle identification. The prevalence of this problem is leading to further refinements in the techniques, which should improve the ability of FT-IR to address it.
References
- “Great Pacific Garbage Patch: Pacific Trash Vortex,” National Geographic special report,https://www.nationalgeographic.org/encyclopedia/great-pacific-garbage-patch/
- N.P. Walsh, I. Formanek, J. Loo, and M. Phillips, “Plastic Island: How Our Throwaway Culture Is Turning Paradise into a Graveyard,” CNN.com,http://www.cnn.com/interactive/2016/12/world/midway-plastic-island/.
- L. Messinger, “How Your Clothes Are Poisoning Our Oceans and Food Supply,” The Guardian Common Ground report,https://www.theguardian.com/environment/2016/jun/20/microfibers-plastic-pollution-oceans-patagonia-synthetic-clothes-microbeads.
- J. Wagner, Z.-M. Wang, S. Ghosal, C. Rochman, M. Gassel, and S. Wall, Anal. Methods9, 1479–1490 (2017).
Michael Bradley, Suja Sukumaran, Steven Lowry, and Stephan Woods are with Thermo Fisher Scientific in Madison, Wisconsin. Direct correspondence to: mailto:mike.bradley@thermofisher.com


Newsletter
Get essential updates on the latest spectroscopy technologies, regulatory standards, and best practices—subscribe today to Spectroscopy.


