Publication
Article
Spectroscopy
Optical Properties of the Suwannee River Fulvic Acid Complexation with Thorium Using 3D Fluorescence Spectroscopy
The relationship between the complexation amount of thorium (Th) and Suwannee River fulvic acid (SRFA) and the changes in Th concentration and pH were studied using differential spectroscopy and 3D excitation-emission matrix fluorescence spectroscopy (3D EEM). Experiments were performed at different Th concentrations and pH values. In the differential spectra at different concentrations, four bands of aromatic components appeared, and thorium was complexed with the carboxyl groups in SRFA. The 3D EEM spectra showed a fulvic acid-like fluorescence region, a visible-light fulvic acid region, and the blueshift phenomenon. The fluorescence intensity decreased with increasing thorium concentration and increased with increasing pH. The results showed that the amount of complexation of thorium and SRFA increased with increasing thorium concentration, and high pH was not conducive to the complexation of thorium and SRFA.
Thorium, associated with the migration of disposed nuclear waste from solid to water phases, has increasingly been studied because of its safe characteristics, including low-level radioactivity and chemical toxicity. Natural organic matter (NOM) plays an important role in the surface water environment, and is involved in physical, chemical, and biological reactions. NOM affects the migration, transformation, and potential toxicity of heavy metals because of ion exchange, adsorption, and chelation (1–3). Because thorium is widely distributed on Earth, the study of the behavior between thorium and NOM is key in controlling radionuclide pollution in the environment.
Research on thorium and NOM adsorption has received considerable attention. Reiller (4) studied the Th(IV) and humic acid (HA) adsorption on hematite and goethite; in the pH range of 3.5–9.5, HA easily complexed with hematite surface sites, and the adsorption of Th(IV) decreased. Chen (5) investigated the removal behavior of Th(IV) in multi-component systems containing silica (SiO2) in the presence of HA and FA, and found that humic substances (HS) could enhance Th(IV) sorption at low pH. Moreover, Th(IV) sorption was reduced at intermediate and high pH values according to the relationships ≡MOH+H+↔≡MOH2+ in acidic media and ≡MOH↔ ≡MO−+H+ in alkaline solutions. In experiments without or with soil FA/HA, the sorption of Th(IV) on TiO2 strongly depended on pH, but weakly depended on the ionic strength, and the presence of HA enhanced the sorption of Th(IV) onto TiO2 (6). Alpatova thought that low metal rejection in the absence of HS at higher pH proved an effect of the HS–metal complexation on the metal rejection (7). We tested the complexation between different types of NOM and lead, and investigated their binding properties (8). However, the chemical formulas that describe the complexation between NOM and heavy metals are seldom discussed.
Regarding the binding of Th4+ with HA, Th4+ bound to carboxylate sites on gray HA only form a 1:1 complex, and the binding constant increases with the degree of ionization and the pKa of the HA (9). Thorium and soil organic matter can form stable thorium-organic complexes, and HA can enhance the complexation adsorption of free thorium ions with humic materials (10).
The UV spectroscopy of HS can obtain information about chromophores, and differential absorbance spectroscopy can be used to quantify the protonation and site specificity of FA in situ (11). Differential absorbance spectroscopy has high sensitivity and can detect subtle chemical changes in NOM, and the complexation effect of humic acid on metal ions was quantified (5,12). Fluorescence spectroscopy can determine the binding characteristics between metal and humus (13). When metals and humus are combined, pH and metal form can cause changes in the fluorescence intensity that can be used to determine the binding characteristics of humus components and trace metals (14,15). Here, fluorescence spectrometry and differential absorbance spectra were used to track the complexation between thorium and SRFA, detect the behavior of fluorescence spectra-based parameters, and quantify their associations with the Th concentration and pH value.
Materials and Methods
Reagents and Solutions
Thorium(IV) perchloric acid with a concentration of 1,001 ±5 mg/L was obtained from Inorganic Ventures, Inc. The HA was standard Suwannee River fulvic acid (SRFA, the International Humic Substance Society). SRFA was diluted to 50 mg/L to obtain a concentrated stock. Dissolved organic carbon (DOC) was analyzed by a Shimadzu TOC-VCSH carbon analyzer.
A concentrated stock of 0.1 mol/L NaClO4 was prepared to dilute solutions to a background ionic strength of 0.01 mol/L. NaOH and HClO4 (1.00 mol/L, 0.10 mol/L, and 0.01 mol/L) were prepared to adjust the pH of the solutions.
Experimental
Three milliliters of 0.1 mol/L NaClO4, 3 mL of 50 mg/L (DOC) SRFA and different amounts of Th were added to a beaker, and the solution was diluted to 30 mL. The NaClO4 concentration was 0.01 mol/L, the DOC was 5 mg/L, and the pH of the solution was adjusted to 4.00, 5.00, and 6.00. UV spectroscopy (PerkinElmer Lambda 18 UV/vis spectrophotometer with a 5-cm cell) and 3D excitation-emission matrix fluorescence spectroscopy (3D EEM) (LS-50B fluorometer) were used to assess the solutions of each pH. Solutions of 0.0, 0.05, 0.1, 0.2, 0.3, 0.4, 0.6, 0.8, 1.0, 2.0, 3.0, and 5.0 mg/L Th were analyzed with UV spectroscopy, and solutions of 0.0, 1.0, 2.0, 3.0, and 5.0 mg/L Th were analyzed with 3D EEM. The pH adjustment reaction lasted 5–10 min. UV and 3D EEM measurements were then performed for solutions with different pH values and Th concentrations. Each concentration solution was repeated three times, and the mean value was used as the final result of spectral analysis. The free thorium concentration was analyzed through differential pulse voltammetry (DPV, Shanghai Chenhua Electrochemical Workstation CHI760E) with a hanging mercury drop electrode (HMDE).
Results
UV Spectroscopy of Thorium and SRFA
Figure 1 shows the absorbance spectra for complexes between SRFA and thorium at varying thorium concentrations. In Figure 1, the absorbance spectra have a consistent and monotonic increase from 500 nm to 225 nm, and increase with the thorium concentration because of various light-absorbing components in NOM (16). However, there was little difference between the different pH absorbance spectra before data processing, and the UV spectra are mainly affected by carboxylic groups at pH <7 (11). The curves of the absorbance spectra for thorium and SRFA complexation were smooth and did not exhibit characteristic absorption peaks because of the vast array of potentially dissimilar aromatic constituents in FA. The spectra exhibit featureless shape characteristics with increasing thorium concentration.

 pH = 4.0; (b) pH = 5.0; (c) pH = 6.0.")
FIGURE 1: Effect of pH on the absorbance spectra of complexation between SRFA and thorium; SRFA = 5.0 mg/L; Th = 0, 1, 2, 3 and 5 mg/L. (a) pH = 4.0; (b) pH = 5.0; (c) pH = 6.0.
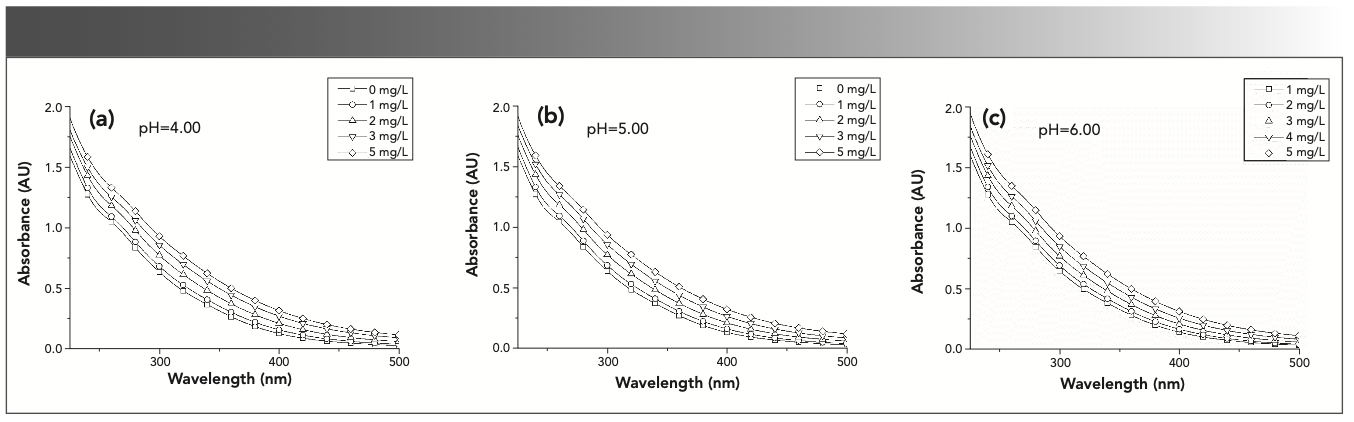
HSs are typically closely linked to the adsorption and chelation of heavy metal ions because of their aromatic groups, and adsorption occurs at the carboxylic and phenolic groups. The characteristic changes in C-H, C-O and C=O groups, according to UV spectroscopy, are an effective tool to indicate humic structural changes caused by the adsorption reaction. However, from Figure 1, the bands of the absorbance spectra have little difference, and the only detectable trend based on the analysis of the raw absorbance spectra was that increasing thorium concentration was accompanied by a consistent and monotonic increase in absorbance at all wavelengths. This effect was attributed to the deprotonation of chromophores and possible conformational changes in the FA molecules (17).
3D EEM of Thorium and SRFA
There are functional groups such as aromatic carboxylic groups, phenolic groups, and unsaturated fatty acids in SRFA, so fluorescence spectroscopy techniques can be used to assess humic structures (18,19). Because paramagnetic metal ions produce fluorescence quenching of dissolved organic matter (DOM), the fluorescence intensity decreases because of quenching, and the fluorescence spectra can be used to check the ligand effects between paramagnetic metal ions and NOM (20,21). The fluorescence spectra of SRFA with thorium are shown in Figure 2.

 Thorium concentrations from 0 mg/L to 5 mg/L; and (Columns 1 through 3) pH at 4.0, 5.0, and 6.0.")
FIGURE 2: 3D EEM spectra of the complexation between thorium and SRFA. (Rows 1 through 5) Thorium concentrations from 0 mg/L to 5 mg/L; and (Columns 1 through 3) pH at 4.0, 5.0, and 6.0.
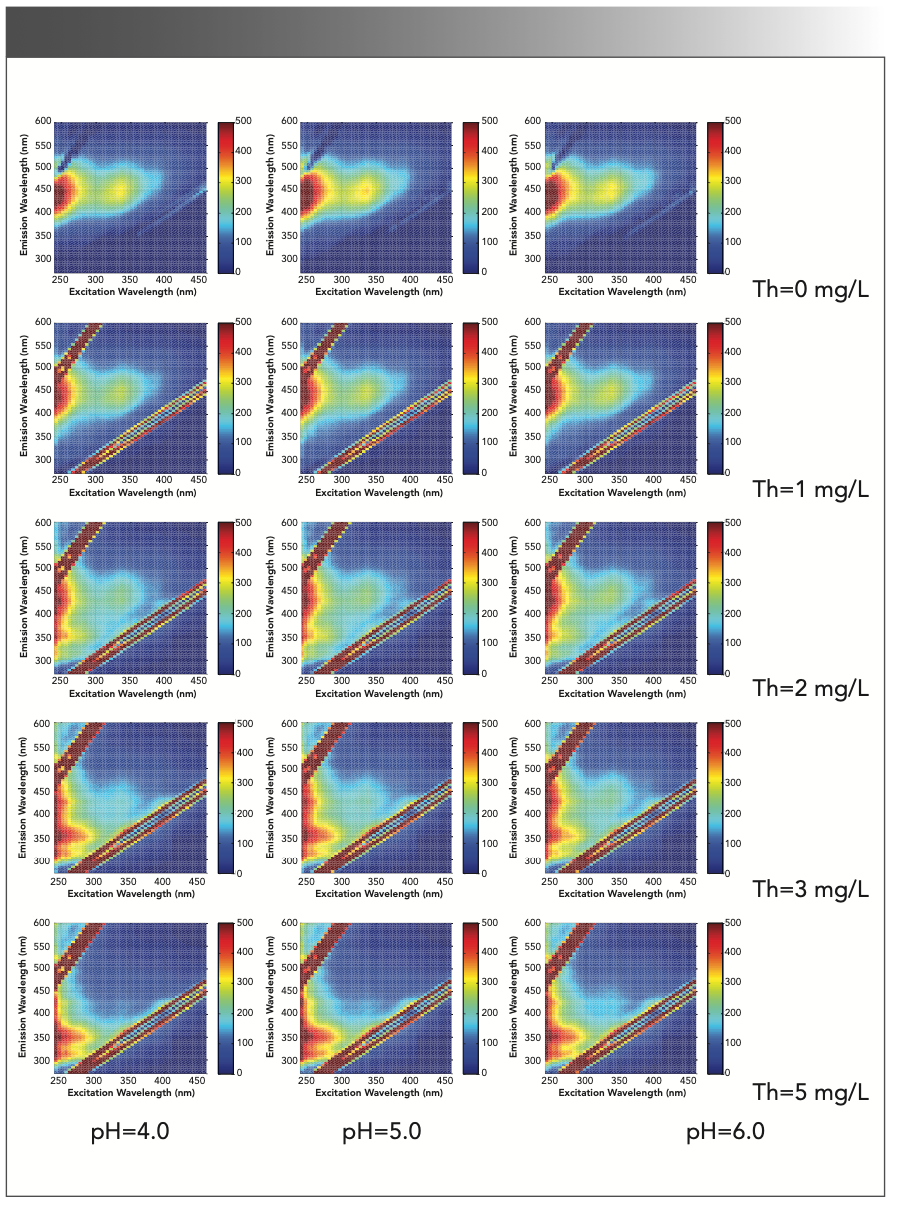
Figure 2 shows the typical EEM spectra of SRFA with and without thorium (SRFA = 5.00 mg/L; ionic strength = 0.01 mg/L NaClO4). The spectra are characterized by two peaks at excitation/emission (Ex/Em) values of <240/440 nm (P1) and 335/450 nm (P2), which are common in the EEM spectra of terrestrial and organic matter. Peak P1 is in the range of 220–240 nm Ex and 410–450 nm Em, which has been previously classified as the UV fulvic-like region, and peak P2 is in the range of 330 nm–370 nm Ex and 420 nm–460 nm Em, which has been classified as the visible fulvic-like region (22–24).
In Figure 2, the EEM spectrum of SRFA with 1.0 mg/L thorium has the same peaks, and only P1 has a blueshift from <240/440 nm to <240/425 nm (Ex/Em), while P2 remains essentially unchanged. When the thorium concentration increases to 2.0 mg/L, P1 remains at 240/425 nm, and P2 shifts to 335/425 nm. The emergence of the blueshift shows a decrease in the number of organic aromatic rings, a decrease in molecular weight, or a reduction of polar groups in solution, such as the carboxyl, amino, and hydroxyl groups (25,26).
Discussion
UV Spectroscopic Analysis of Thorium and SRFA
From Figure 1, differential absorbance spectra (ΔATh[λ]) are calculated as follows:


where ATh(λ) and ATh_ref(λ) are the absorbance spectra at the wavelength measured at a certain thorium concentration and at Th = 0.0 mg/L.
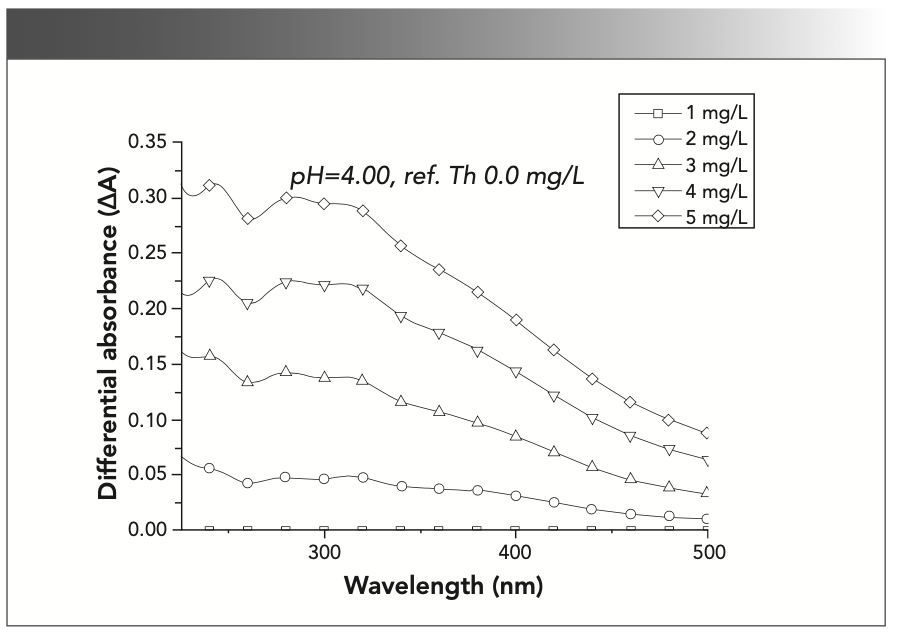
For example, the differential absorbance spectra at pH 4.0 in Figure 3 contain four bands: a band at 235–265 nm with a relatively sharp peak at 247 nm; a band at 265–300 nm with a peak at 280 nm; a band at 300–350 nm with a peak at approximately 320 nm; and a band below 320 nm with a peak at approximately 380 nm. Similar peaks appeared in the studies of Yan, Chen, and Dryer, which indicates that these peaks represent the aromatic composition and absorbance of chromophore (11,27,28). Among chromophores, carboxylic chromophores overwhelmingly contribute to absorbance changes in the pH range of 3–5, and the differential spectra were dominated by a prominent peak near 280 nm; in contrast, phenolic chromophores predominated at pH >8, and exhibited a peak near 390 nm (11,29). According to Figure 3, the changes among different thorium concentrations decrease when the thorium concentration increases; for example, the difference between 5 mg/L and 3 mg/L thorium was less than that between 3 mg/L and 2 mg/L thorium. If the absorbance is because of complexation between thorium and SRFA, the absorbance increases with the thorium concentration, and the complexation amount would approach the amount of SRFA if the SRFA concentration was fixed. However, in the complex of SRHA with rare earth ions, with the increase in concentration, the absorbance decreases at 260 nm and increases at 320 and 387 nm, while the absorbance of Pahokee Peat humic acid (PPHA) decreases because of the interaction of Eu3+ (12,28). The change in aromatic groups in SRFA in the presence of metal was because of the unshared electron pairs or π electron pairs in the SRFA functional groups (30). Thorium complexation with carboxylic chromophores in SRFA displaces the electrons and enhances the aromaticity of SRFA, and the absorbance at 280 nm and 390 nm was increased.


FIGURE 3: Differential absorbance spectra of the complexation between SRFA and thorium relative to a reference spectrum of Th = 0.0 mg/L.
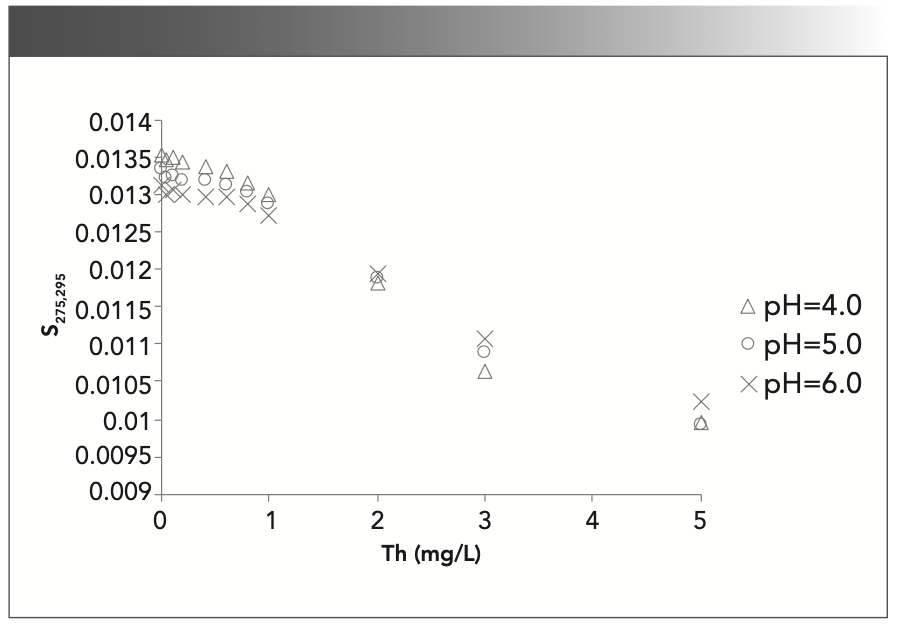
The DOM absorption spectrum follows the equation Aλ = Aλ0 × exp (-S × [λ - λ0]) + K. In the equation, λ is the wavelength (nm); λ0 is the reference wavelength (400 nm); Aλ and Aλ0 are the absorbances at λ and λ0, respectively; S is the spectral slope; and K is the residual scattering or residual noise offset. The spectral slope (S) values of a narrow wavelength range (275–295 nm) are recommended as indicators of the molecular weight (MW), source, and photobleaching of chromophoric dissolved organic matter (CDOM) (31–33).
In Figure 4, the changes in S275–295 exhibit a striking relationship, and the spectral slope (S) decreases with the thorium concentration. The S275–295 curve gently changes at low concentrations (0.0–1.0 mg/L) and high concentrations (3.0–5.0 mg/L) and has S-curve characteristics. Helms (31) proposed that the 275–295-nm slope was routinely reported in future DOM studies, since it could be measured with high precision and appeared to be a good proxy for DOM MW, where S275–295 is negatively correlated with DOM MW. In Figure 4, S275–295 decreases when the thorium concentration increases, so the average MW increases when the thorium concentration increases. This result may indicate the thorium ion complexation with SRFA molecules, and many SRFA molecules gather into larger FA molecules. S275–295 hardly varies with respect to pH except at 0.0 mg/L thorium, indicating that the thorium concentration (0.0–5.0 mg/L) has a greater impact than pH (4–6) on the spectral slope, and thorium is the main factor that changes the UV spectral results.


FIGURE 4: Spectral slope parameters with respect to the thorium concentration and pH.
3D EEM Analysis of Thorium and SRFA
In Figure 4, after thorium was added to the SRFA solution, the SRFA molecules gathered into larger FA molecules, and there was no redox reaction in solution, so the blueshift was because of a reduction in the polar groups. Therefore, the thorium complexation with SRFA occurred on carboxyl or hydroxyl groups, and similar studies have shown that carboxyl and hydroxyl groups participate in the complexation of heavy metal ions (34). After the thorium concentration increased to 3.0 mg/L, P2 gradually decreased, and there was a new peak at <240/345 nm (P3). The outermost electron arrangement of Th(IV) was saturated 6d26p6, which is identical to the structure of noble gas, so Th(IV) is a diamagnetic ion, which can change the structure of organic ligands into the rigid planar structure, and make organic ligands show strong fluorescence. The addition of Al3+ to fulvic acid by Kelly also proves the change in structure of organic ligands (35); thus, P3 belongs to the ligand of SRFA and thorium. In most cases, the fluorescence intensity of complexation between SRFA and thorium decreases when the thorium concentration increases. Because the peak blueshift and fluorescence intensity change, the carboxyl and hydroxyl groups in SRFA can complex with thorium when the thorium concentration increases, and the decrease in fluorescence intensity can be related to thorium binding to SRFA.
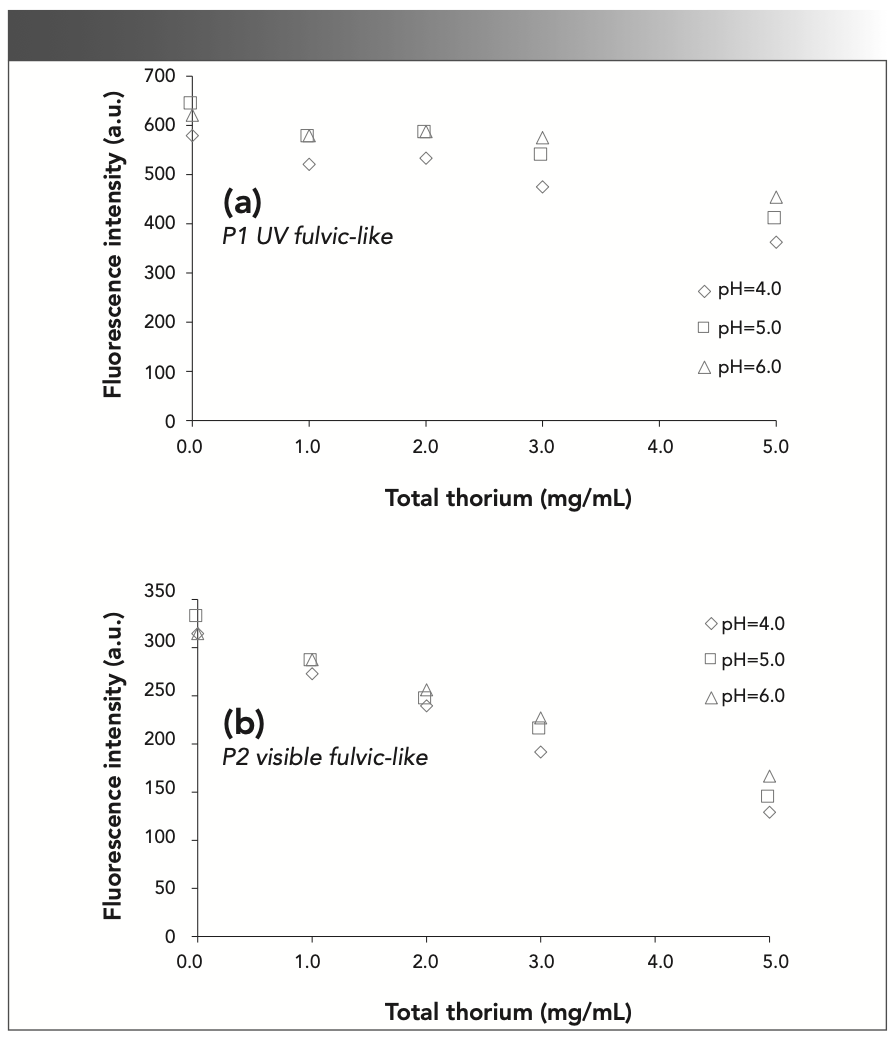
The fluorescence intensities at P1 and P2 are listed in Figure 5. From Figure 5a, the fluorescence intensity overall has a downward trend in the UV fulvic-like (P1) region, but its variation trend is not obvious. First, the fluorescence intensity decreases from 0.0 mg/L to 1.0 mg/L thorium, increases at 2.0 mg/L thorium, and finally decreases again when the thorium concentration increases to 3.0 mg/L and 5.0 mg/L. In Figure 5b, the fluorescence intensity decreases when the thorium concentration increases with a maximum at 0.0 mg/L thorium and a minimum at 5.0 mg/L thorium. This is similar to the fluorescence intensity when SRHA is complexed with rare earth ions Eu3+ and Tb3+, and there is a certain correlation between the amount of complexation and the fluorescence intensity (12). When the concentration of Cr2O72- increases, the fluorescence intensity begins to decrease, and the conformation and function of HA will change (12,36). In particular, the fluorescence intensity at different thorium concentrations increases with pH. This result indicates that the complexation between SRFA and thorium decreases with pH, and thorium has difficulty combining with SRFA at higher pH.

 240/440 nm (P1); and (b) 335/450 nm (P2) with different thorium concentrations and pH values.")
FIGURE 5: Fluorescence intensity at (a) 240/440 nm (P1); and (b) 335/450 nm (P2) with different thorium concentrations and pH values.
Optical Characteristics of Complexation Between Thorium and SRFA
The Visual Minteq database has been proven to be a reasonable and effective tool to simulate the amount of complexation between SRFA and metal ions (12,37). The above data suggest that thorium addition causes SRFA molecules to gather into larger FA molecules. A comparison of S275–295 and the fluorescence intensity at P1 (UV fulvic-like) is shown in Figure 6.

 the thorium concentration and calculated complexation, and (b) spectral slope for calculated complexation vs. S275-295.")
FIGURE 6: Relationships between (a) the thorium concentration and calculated complexation, and (b) spectral slope for calculated complexation vs. S275-295.
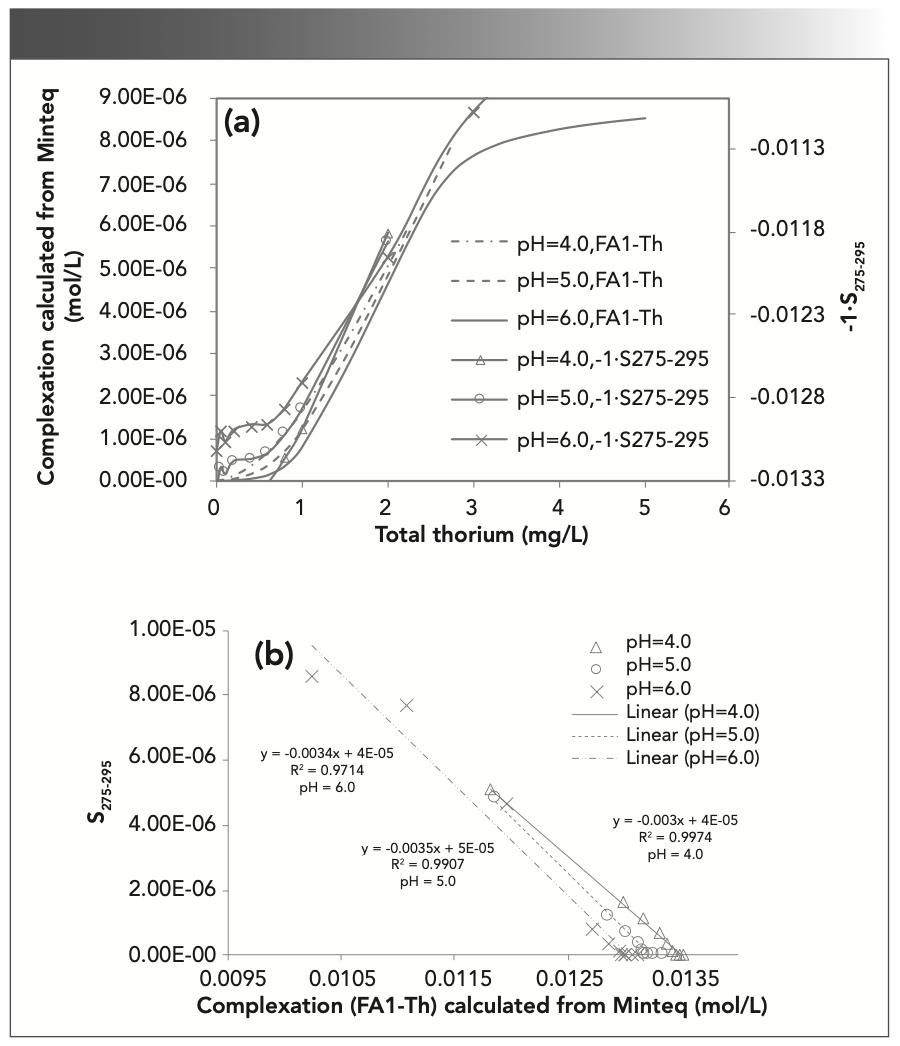
In Figure 6, the complexation amount of Th and SRFA calculated by Minteq increases with increasing Th concentration; -1•S275–295 is also proportional to the concentration of Th, but S275–295 is inversely proportional to the amount of complexation (Figure 6b), which shows a significant negative linear relationship with R2 > 0.9. S275–295 can be used to measure the change in MW: when the concentration of Th increases, the amount of complexation increases, the MW increases, and the spectral slope monotonically decreases. This relationship shows that the aromaticity of SRFA is enhanced, and there was a negative correlation between spectral slope and aromaticity (38). The -1•S275-295 and complexation amount of each pH are shown as pH 6 > pH 5 > pH 4. These results indicate that high pH will hinder the complexation of FA with Th. When the pH value increases, the concentration of OH– increases, the ability to compete with FA is strengthened, and the amount of FA1-Th complexation decreases (39). A change in pH will affect the charge of humus, and an electric field will affect the complexation (40).
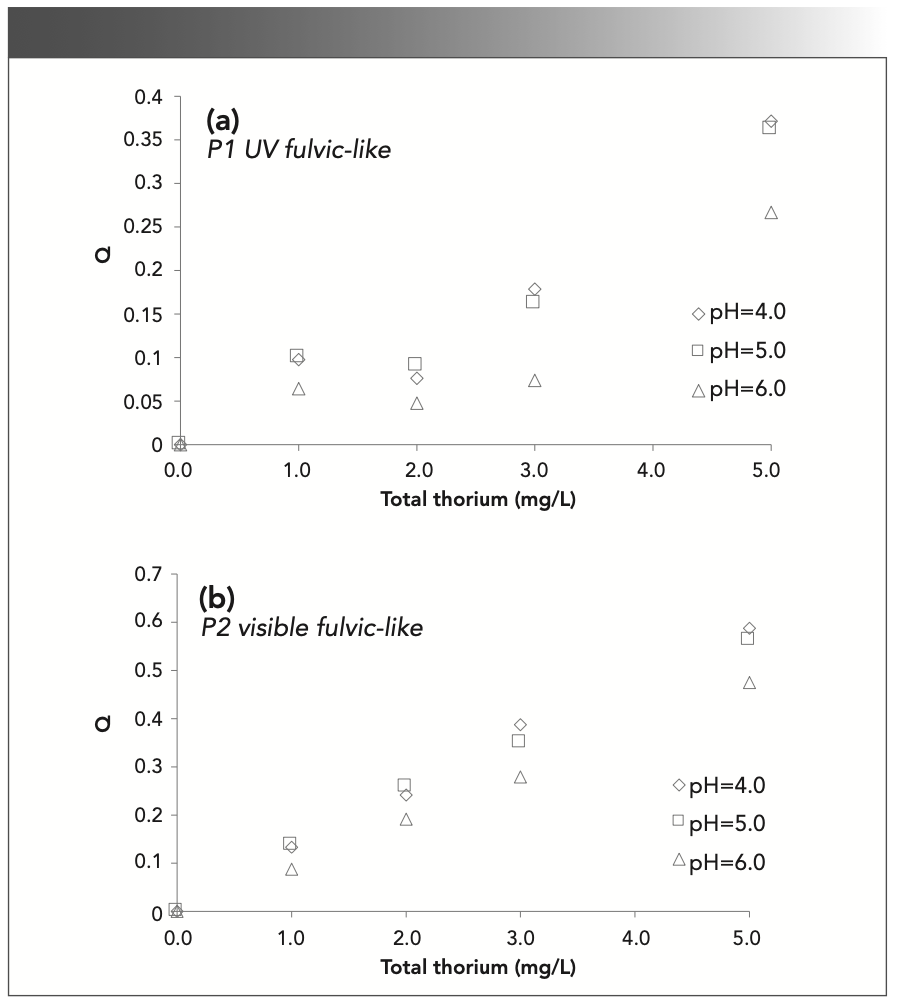
In this study, the fluorescence intensity of 0.0 mg/L thorium was used as a reference, and the Q values of FA and HA were calculated as follows:


The Q values according to the total thorium concentration are listed in Figure 7. Q has an inverse relationship with the fluorescence intensity (I). In Figure 7a, Q increases with the thorium concentration in most of the UV fulvic-like region. In Figure 7b, Q monotonically increases in the visible fulvic-like region. The MW of FA in the visible-light region is larger than that in the UV region, and the coordination ability is stronger, so the Q value in Figure 7b increases faster with the total thorium amount (41). The Q value at pH 5.0 is similar to that at pH 4.0, and greater than that at pH 6.0. The Q value is related to the complexation between SRFA and thorium. When the pH value is low, thorium easily complexes with SRFA. In contrast, a higher pH value will make the molecular form of FA more open and present a linear structure, which reduces the Q value (42).

 240/440 nm (P1); and (b) 335/450 nm (P2) with different thorium concentrations.")
FIGURE 7: Q calculated from the fluorescence intensity at (a) 240/440 nm (P1); and (b) 335/450 nm (P2) with different thorium concentrations.
Conclusion
In complexes with the carboxyl and hydroxyl groups of SRFA, when the Th concentration increases, complexation increases, the MW increases, the spectral slope decreases, the fluorescence intensity decreases, and the aromaticity of SRFA increases. There are FA-like fluorescent regions and visible-light FA fluorescent regions. S275–295 can measure the change in MW. High pH will hinder the complexation of FA and Th. The complexation of Th and SRFA decreases with increasing pH. The Q value at pH 5.0 is similar to that at pH 4.0 and greater than that at pH 6. The Q value is related to complexation between SRFA and thorium. When the pH value is low, thorium is easily complexed with SRFA. In contrast, a higher pH value will make the molecular form of FA more open and present a linear structure, which reduces the Q value.
Funding
This study was sponsored by the Scientific Research Fund of Yunnan Provincial Education Department, China (Grant number 2022J0524) and the General Project of The National Natural Science Foundation of China (31860126).
References
(1) A. Nebbioso and A. Piccolo, Anal. Bioanal. Chem. 405(1), 109–124 (2013).
(2) A. Philippe and G. E. Schaumann, Environ. Sci. Technol. 48(16), 8946–8962 (2014).
(3) L. Wang, Y. Liu, X. Shu, S. Lu, X. Xie, and Q. Shi, PloS One 14(9), e0218742 (2019).
(4) P. Reiller, V. Moulin, F. Casanova, and C. Dautel, Appl. Geochem. 7(12), 1551–1562 (2002).
(5) C. Chen and X. Wang, Appl. Radiat. Isot. 65(2), 155–163 (2007).
(6) X. Tan, X. Wang, C. Chen, and A. Sun, Appl. Radiat. Isot. 65(4), 375–381 (2007).
(7) A. Alpatova, S. Verbych, M. Bryk, R. Nigmatullin, and N. Hilal, Sep. Purif. Technol. 40(2), 155–162 (2004).
(8) T.M. Filella, Sci. Total Environ. 300(1–3), 143–154 (2002).
(9) A.A. Helal, J. Radioanal. Nucl. Chem. 274(3), 575–580 (2007).
(10) P. Guo, T. Duan, X. Song, J. Xu, and H. Chen, Talanta 77(2), 624–627 (2008).
(11) D.J. Dryer, G.V. Korshin, and M. Fabbricino, Environ. Sci. Technol. 42(17), 6644–6649 (2008).
(12) Y. Chen, M. Fabbricino, M.F. Benedetti, and G.V. Korshin, Water Res. 68, 273–281 (2015).
(13) H. Ma, L. Huang, J. Zhang, D. Shi, and J. Yang, Environ. Pollut. 242(part A), 760–768 (2018).
(14) Y. Yamashita and R. Jaffe, Environ. Sci. Technol. 42(19), 7374–7379 (2008).
(15) F. Wu, Y. Cai, D. Evans, and P. Dillon, Biogeochemistry 71(3), 339–351 (2004).
(16) W. Chen and H-Q. Yu, Water Res. 190, 116759 (2020).
(17) M. Grassi and M. Rosa, Inorg. Chim. Acta 363(3), 495–503 (2009).
(18) E.M. Carstea, A. Baker, M. Bieroza, and D. Reynolds, Water Res. 44(18), 5356–5366 (2010).
(19) N. Patel-Sorrentino, S. Mounier, and J.Y. Benaim, Water Res. 36(10), 2571–2581 (2002).
(20) T. Ohno, A. Amirbahman, and R. Bro, Environ. Sci. Technol. 42(1), 186–192 (2008).
(21) S.L. Zhang Xiao, W. Zhao-qun, S. Bi-quan, L.Hai-su, and X. Zi-yan, Spectroscopy 35(S5), 32–38 (2020).
(22) F.U. Ping-Qing and L. Cong-Qiang, Spectroscopy and Spectral Analysis 25(12), 2024–2028 (2005).
(23) A. Baker, Water Res. 36(1), 189–195 (2002).
(24) F. Wu and E. Tanoue, Environ. Sci. Technol. 35(18), 3646–3652 (2001).
(25) T. Zhang, J. Lu, J. Ma, and Z. Qiang, Chemosphere 71(5), 911–921 (2008).
(26) J. Świetlik and E. Sikorska, Water Res. 38(17), 3791–3799 (2004).
(27) M. Yan, J. Ma, and G. Ji, Water Res. 93(Apr. 15), 84–90 (2016).
(28) Y. Chen, M. Fabbricino, V. Luongo, and G.V. Korshin, Chemosphere 235, 96–103 (2019).
(29) G.V. Korshin, M.M. Benjamin, H.S. Chang, and H. Gallard, Environ. Sci. Technol. 41(8), 2776–2781 (2007).
(30) D. Hernández, C. Plaza, N. Senesi, and A. Polo, Environ. Pollut. 143(2), 212–220 (2006).
(31) J.R. Helms, A. Stubbins, J.D. Ritchie, E.C. Minor, D.J. Kieber, and K. Mopper, Limnol. Oceanogr. 53(3), 955–969 (2008).
(32) Y. Zhang, M.A.V. Dijk, M. Liu, G. Zhu, and B. Qin, Water Res. 43(18), 4685–4697 (2009).
(33) C.G. Fichot and R.Benner, Limnol. Oceanogr. 57(5), 1453–1466 (2012).
(34) A. Piccolo and J.F. Stevenson, Geoderma 27(3), 195–208 (1982).
(35) K.M. Elkins and D.J. Nelson, J. Inorg. Biochem. 87(1–2), 81–96 (2001).
(36) Y.L. Gu, M.X. Yin, H.M. Zhang, Y.Q. Wang and J.H. Shi, Spectrochim. Acta, Part A 136(2), 1702–1709 (2015).
(37) C.J. Milne, D.G. Kinniburgh, and E. Tipping, Environ. Sci. Technol. 35(10), 2049– 2059 (2003).
(38) N.V. Blough and S. Green, in Role of Nonliving Organic Matter in the Earth’s Carbon Cycle, R.G. Zepp and C. Sonntag, Eds. (John Wiley & Sons, New York, NY, 1995) pp. 23–45.
(39) S. Abalikmu, A. Ilahong, T. Turhong, and A. Aubri, Xinjiang Agricultural Sciences 49(9), 1701–1706 (2012).
(40) M.A. Ramos, S. Fiol, R. López, J.M. Antelo, and F. Arce, Environ. Sci. Technol. 36(14), 3109–3113 (2002).
(41) W. Kaifeng, P. Na, H. Jiang, W. Libin, and L. Siwu, Environ. Sci. Technol. 40(10), 151–156 (2017).
(42) S.d.C. Saab, E.R. Carvalho, R. Bernardes Filho, M.R.d. Moura, L. Martin-Neto, and L.H.C. Mattoso, J. Braz. Chem. Soc. 21(8), 1490–1496 (2010).
Xiao Long Sun, Xiangshu Ma, Liu Leng, and Yichuan Fang are with the Wetland College of Southwest Forestry University and the National Plateau Wetland Research Center, in Kunming City, China. Direct correspondence to Xiao Long Sun at sunxl.96@qq.com ●


 Bonds")


Newsletter
Get essential updates on the latest spectroscopy technologies, regulatory standards, and best practices—subscribe today to Spectroscopy.


![Figure 3: Plots of lg[(F0-F)/F] vs. lg[Q] of ZNF191(243-368) by DNA.](https://cdn.sanity.io/images/0vv8moc6/spectroscopy/a1aa032a5c8b165ac1a84e997ece7c4311d5322d-620x432.png?fit=crop&auto=format)


