Publication
Article
Spectroscopy
Recent Developments in X-ray Analysis
Author(s):
In our annual presentation of trends in X-ray analysis, experts in the field provide updates on recent developments in X-ray analysis, focusing on the technique and relevant applications.
The topics discussed include a comparison of total reflection X-ray fluorescence (TXRF) and graphite furnace atomic absorption spectrometry (GFAAS) for the analysis of trace meals in biological materials, the use of grazing incidence X-ray diffraction to study nanostructured layers, multielemental analysis of apatite crystals by TXRF, and tracing the absorption and transport of foliar sprayed nutrients in plants.
Comparison of Total Reflection X-ray Fluorescence (TXRF) and Graphite Furnace Atomic Absorption Spectrometry (GFAAS) for Analysis of Trace Metals in Biological Material
Martina Schmeling and Michelle Gende, Loyola University Chicago, Chicago, Illinois
A sample preparation procedure was developed for analyzing trace metals in biological materials using Escherichia coli as the model organism. The samples were spiked with specific trace metal concentrations, and the prepared samples were analyzed by both total reflection X-ray fluorescence (TXRF) and graphite furnace atomic absorption spectrometry (GFAAS). Both measurement techniques were similarly effective and produced similar results, but some concentration differences existed for one of the added target elements because of the naturally present concentration of this element. More experiments choosing different standard elements are planned to validate these results.
Trace metals are involved in many biological functions by acting as cofactors in enzymes and stabilizing proteins. The excess of a trace metal and the lack thereof can be detrimental to an organism and result in malfunctions and disorders. Trace metals can also be toxic and disrupt fundamental enzymatic processes as is the case for lead, which interferes with calcium-dependent enzymes and leads to oxidative stress, among other actions (1). Consequently, it is important to monitor levels of trace metals in biological systems carefully. However, this is not an easy task because one has to consider the high organic matrix content, the presence of metabolic elements in high concentrations, and the natural variability of biological materials. The development of a robust and reliable procedure can serve as the basis for future research. Such a procedure should be based on a model system, which is easily available in the laboratory setting and also has sufficient natural variability to be representative. Escherichia coli was discovered in 1885 by T. Escherich and is the most studied microorganism. Its genome is completely sequenced and many groundbreaking discoveries in genetics and microbiology have used E. coli as a model system (2). It is the basis for biotechnological processes and is often used in therapeutics. Moreover, E. coli has the advantage over more complex organisms in that it is easy to grow in the laboratory; as a result, it lends itself for research purposes.
We present here the initial results obtained for the development of a sample preparation method to determine trace metals in E. coli by total reflection X-ray fluorescence (TXRF) and graphite furnace atomic absorption spectrometry (GFAAS). The samples were artificially spiked with chromium and copper at predetermined concentrations. We selected chromium and copper because both elements are essential for many biological systems and are also easily detectable at those levels by both methods. For TXRF quantification, we used gallium as the internal standard, and it was added to the samples together with chromium and copper, whereas for GFAAS, we used external calibration for quantification.
Materials and Methods
All the samples were prepared from the same E. coli BL21 cell line and grown in Luria-Bertani broth (Fisher Bioreagents) for 12–18 h at 37 °C. (3). The cells were harvested after being centrifuged for 5 min at 5000 rpm and washed twice with 5 mL of 50 mM Hepes ((4-(2-hydroxyethyl)-1-pi-perazineethanesulfonic acid; C8H18N2O4S; pH = 7.5; VWR). After the second wash, the cells were resuspended in 500 μL of a balanced salt solution (BSS) and then dispersed in 50 μL aliquots into different 1.5 mL centrifuge tubes. These 50 μL aliquots of cells were dried overnight at 95 °C, and the dried cell pellets were stored at room temperature until they were ready for final sample preparation.
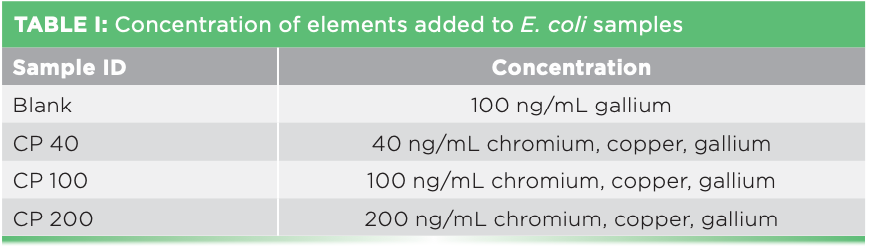
For analysis by TXRF and GFAAS, 500 μL of a 1:4 H2O2 (30%):HNO3 (70%) (both Sigma Aldrich) solution was added to the cell pellets along with standards containing chromium, copper, and gallium (EMD) in different concentrations as shown in Table I. Gallium served as the internal standard. Each set of samples was prepared in triplicate along with one control containing 100 ng/mL gallium also as the internal standard. The resuspended samples were microwave digested at 1200 watts (MW535OW, Samsung Corporation) for 1 min and then dried again for 48 h at 100 °C before adding 500 μL of the solution of 1:4 H2O2:HNO3. The final samples were then divided into equal parts for analysis by TXRF and GFAAS.


For TXRF analysis, 5 μL of each sample was pipetted on a clean and prechecked quartz support and dried in a desiccator overnight. Analysis was carried out with a S2 PicoFox (Bruker) using molybdenum excitation at 50 kV and 600 μA. The counting time was 2000 s. The spectra were evaluated using the factory installed software with gallium as internal standard.
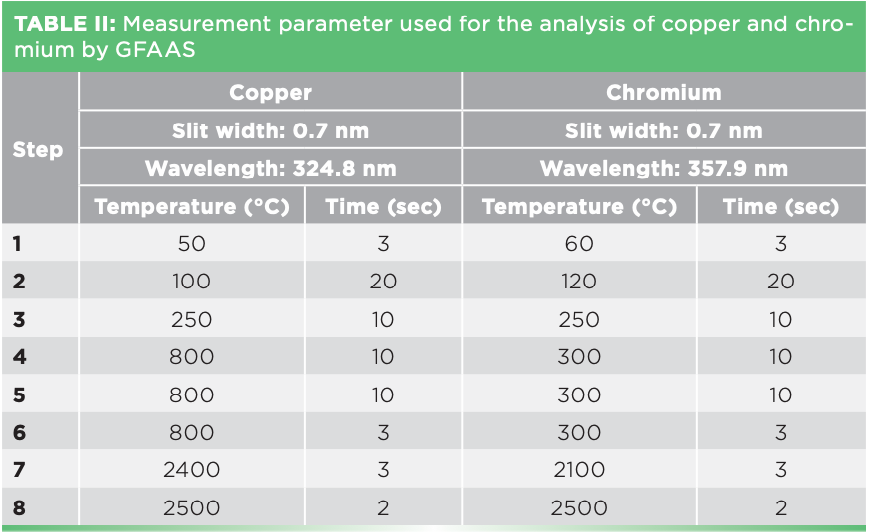
For GFAAS analysis, 20 μL of each sample was pipetted onto the graphite furnace platform and measured using the protocols as shown in Table II (AA-7000 Shimadzu). External calibration in form of calibration curves was used for quantification.


Results
In Figure 1, the TXRF spectrum for one of the samples containing 100 ng/mL chromium, copper, and gallium, with the latter one serving as the internal standard, is displayed.


FIGURE 1: TXRF spectrum of E. coli sample containing 100 ng/mL of chromium, copper, and gallium. The three elements are shown in red text.
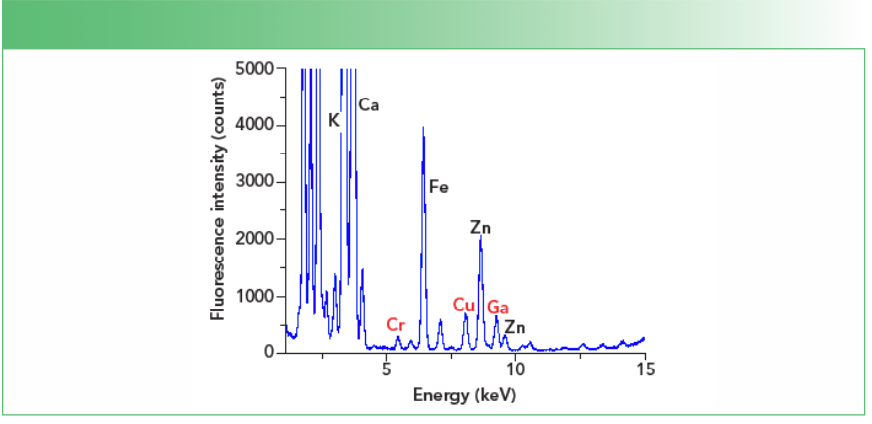
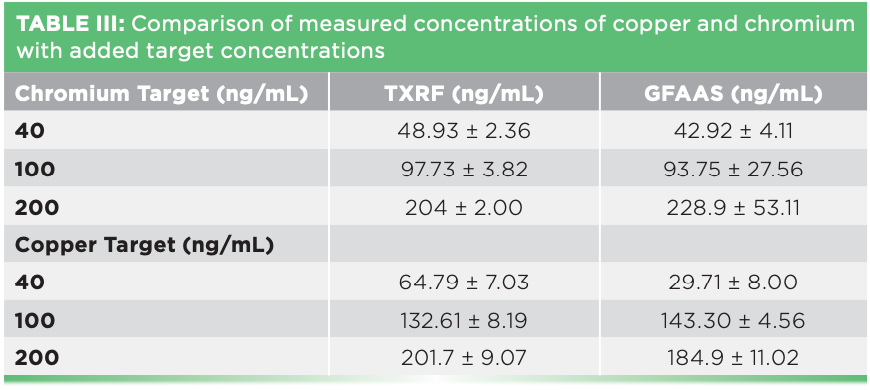
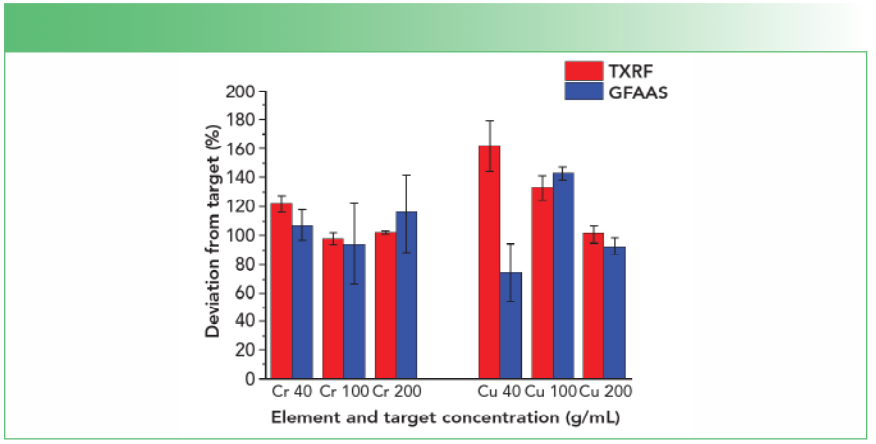
Table III lists the results obtained for each concentration along with its standard deviation. Figure 2 shows the percent deviation from the added target value. For chromium, the measured concentrations were aligned with the target concentrations and only the lowest value was slightly overestimated. Moreover, the agreement between TXRF and GFAAS data was outstanding considering the differences between these two techniques with respect to the quantification method and the type of analysis. For copper, the picture was slightly different: TXRF overestimated the lowest value and GFAAS underestimated it. For the middle value, both TXRF and GFAAS were returning much higher results than expected, and for the upper data point, TXRF was accurate whereas GFAAS underestimated it again.


 and GFAAS (blue bars).")
FIGURE 2: Deviation from target concentrations in percent for chromium and copper for both TXRF (red bars) and GFAAS (blue bars).
There could be several reasons for these discrepancies toward the copper target values: For one, copper was present naturally in the samples in substantial concentrations and natural variability might have played a role even if the cells have grown from the same line and under the same conditions. The average copper concentrations for the nonspiked samples was 75.3 ± 88 ng/mL measured by TXRF and 102 ± 80 ng/mL measured by GFAAS, respectively. On the other hand, the chromium concentration for the nonspiked samples was always below detection limit for both methods. Second, the standard concentrations added to the samples were not exactly on target, which could be the case for the middle value of copper as both methods grossly overestimated it. Finally, the copper distribution on the homogeneous and the GFAAS furnace TXRF sample support was not sufficiently program needed to be better optimized. Because of the reasons described above, It is very likely a combination of all these factors did impact the copper data. Therefore, additional experiments selecting one or more different standard elements are necessary to confirm the results obtained for chromium.
Conclusions
The initial data presented here show agreement between TXRF and GFAAS for the developed sample preparation method with respect to the element chromium, but not for copper. The reason for the latter is possibly because of the large intrinsic and variable copper concentration. Therefore, more experiments are needed with standard elements having below detection limit intrinsic concentrations for both techniques to solidify the data for chromium.
References
(1) G. Flora, D. Gupta, and A. Tiwari, Interdisciplinary Toxicology 5(2), 47–58 (2012).
(2) Z.D. Blount, elife 4, e05826; DOI:10.7554/elife.05826 (2015).
(3) A.R. Tuttle, N.D. Trahan, and M.S. Son, Current Protocols 1, e20; doi:10.10021cpz1.20 (2021).
Martina Schmeling and Michelle Gende are with Loyola University Chicago, in Chicago, Illinois. Direct correspondence to: Mschmel@luc.edu
The Use of Grazing Incidence X-ray Diffraction to Uncover the Strain Relaxation Processes in Highly Dense Nanowire Arrays
Cosmin Romanitan, National Institute for Research and Development in Microtechnology Voluntari, Romania
The grazing incidence X-ray diffraction technique allows nanowire arrays to be scanned along their entire length. The rocking curves, ω-scan, and φ-scan recorded at different incidence angles allow us to obtain the bending and torsion profiles along the z-axis. These profiles help us prove the absence or existence of the strain relaxation processes. Furthermore, quantification of the screw and edge threading dislocation density becomes possible in the framework of the bending and torsion energy profiles. The results point to the close relationship between the nanowire morphology and the strain relaxation processes that give rise to the occurrence of threading dislocations or other structural defects.
Because of their unique and customizable optical and physical properties, low-dimensional materials have undergone a revolution regarding their applications in various fields, including electronics, photonics, and biodevices. A key role at the boundary between the microstructure and the physical properties is represented by the strain and the underlying processes. Strain has always been a double-edged sword for heterostructure design. On the one hand, the constraining of certain materials can be combined to form coherent structures. On the other hand, strain engineering provides a means to modify material properties (1). In this regard, X-ray-based methods provide valuable information for a wide range of materials and push knowledge in material science forward. So far, X-ray analysis of low-dimensional layers has been limited, mostly because of the difficulty of data interpretation, attributed to their strong three-dimensional local inhomogeneity of the investigated materials (2–4).
This article presents our findings related to one-dimensional silicon nanowires (SiNWs) obtained by metal-assisted chemical etching. Specifically, we are interested in the extended structural defects, such as edge- and screw-threading dislocations in highly dense nanowire arrays. Because threading dislocation density represents a key aspect in the context of physical properties, particular attention should be focused on their formation.
The Need for a New Formalism in Nanostructured Silicon
Transmission electron microscopy has been one of the most frequently used techniques to investigate the strain and related defects in nanowire systems (5), with the disadvantage that the strain state can be altered by the flux of the accelerated electron beam. On the other side, spectroscopic techniques, such as Raman spectroscopy (6,7), photoluminescence (8), and X-ray diffraction (XRD), employing both single nanowires (1,4,9) and nanowire arrays, have been utilized (10–12). A major problem in characterizing strain in nonplanar structures is to resolve in a standard framework the interplay between the different contributions given by structural defects, bending and torsion effects in Raman modes, photoluminescence bands, and XRD peaks. Moreover, taking into account the strong anisotropy of the strain along the z-direction, it is necessary to develop suitable spectroscopic methods to discriminate along the z-direction.
For instance, in the case of nanowires, the defective region cannot be treated individually by the free-defect region, because this protocol usually gives misleading results, whether using Raman spectroscopy, photoluminescence, or X-ray rocking curves. The above aspects urged us to find suitable spectroscopic tools that can characterize one-dimensional systems that feature an inherent anisotropy of the strain-related phenomena along the z-direction.
Overcoming the Related Issues to the Nanowires
To gain information at different points along the z-axis, we explored the ability of the X-rays to encode information at different penetration depths via the grazing incidence X-ray diffraction (GI-XRD) technique. This technique allows the tuning of information depth in the range from tens of micrometers for symmetric skew diffraction down to tens of nanometers for strongly asymmetric skew geometries, where the angle of incidence is below the critical angle of total external reflection (13). In this study, GI-XRD (111) reflection was employed, for which the incidence angle of the source (αi) was appropriately adjusted to get a penetration depth of the X-rays comparable with the length of the array, whereas the detector is kept to 2θB. The schematic representation of the grazing incidence X-ray diffraction is shown in Figure 1.

 scheme for depth dependent investigations of porous silicon. Reproduced with permission of the International Union of Crystallography (16).")
FIGURE 1: Grazing incidence X-ray diffraction (GI-XRD) scheme for depth dependent investigations of porous silicon. Reproduced with permission of the International Union of Crystallography (16).
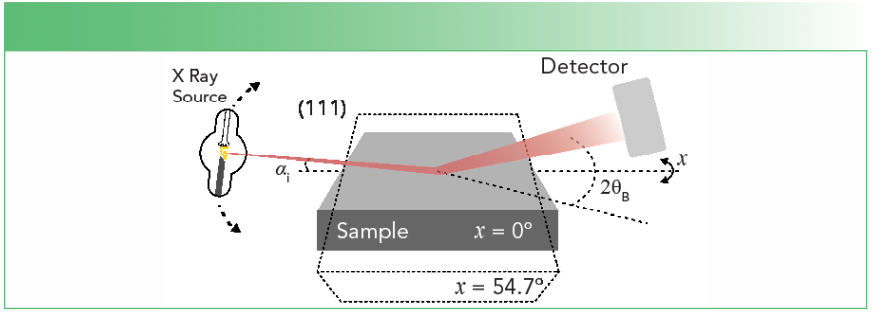
We preferred (111) reflection for these kinds of investigations, because of the high structure factor and high inclination angle, χ = 54.7°, which corresponds to the angle between the (111) and (001) direction. It is worthy to note that in addition to (224) or (115) reflections, for which χ = 35.26 and 15.79°, respectively, a high χ angle allowed us to obtain smaller penetration depths and assess the regions close to the surface. The X-ray penetration depths were calculated based on the Beer-Lambert formula, where the pathlength was assumed as the sum of the incident and the scattered path. Further details in the calculation of the X-ray penetration depth can be found in our previous work (14–16), where grazing incidence X-ray diffraction was applied for silicon nanowires, and GaN was applied for the heteroepitaxial layers and porous silicon, respectively.
Furthermore, by recording multiple rocking curves at different incidence angles, whose value should be adjusted properly considering the length of the nanowire array, we are able to have a complete description of the strain-related phenomena. For instance, ω-scanning measures the tilt (φtilt) of nanowire array, which can be viewed as the bending profile. At the same time, the φ-scan encodes the twist (φtwist), which further express the torsion profile.
Bending and Torsion Profiles in Nanowire Arrays
Figures 2a–c show the bending and torsion profiles for two nanowire arrays with lengths of 1.5 μm and 9.5 μm, denoted further as short and long nanowires.

 Bending and torsion profiles for short and long nanowire arrays, (b) bending and torsion energy profiles and a (d) closer inspection of the energy lost.")
FIGURE 2: (a–c) Bending and torsion profiles for short and long nanowire arrays, (b) bending and torsion energy profiles and a (d) closer inspection of the energy lost.
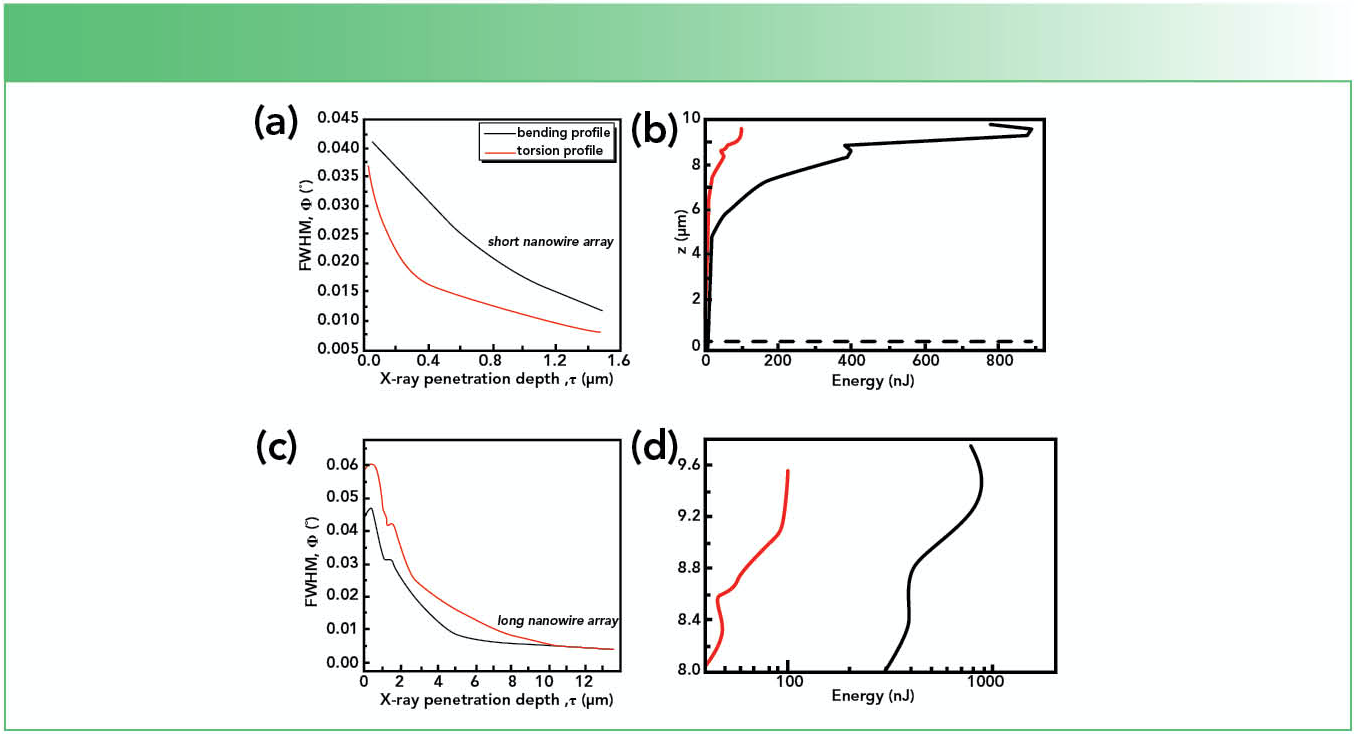
One can observe that for short nanowires both φtilt and φtwist increase monotonically with decreasing penetration depth. By contrast, for long nanowires, both φtilt and φtwist present a dip. In our extensive work (14), we showed this dip is related to the coalescence regions from the upper part of the nanowire arrays and indicates the presence of bending and torsion relaxation mechanisms in the long nanowires. Meanwhile, for the short nanowire array, the relaxation processes are absent.
Quantification of the Threading Dislocations in Nanowire Arrays
To gain a quantitative description of the strain relaxation processes in the long nanowires where they are clearly manifesting, the energy lost through these processes was evaluated. The energy lost was evaluated from the bending and torsion energy profiles as shown in Figure 2b. Whereas the short nanowire array does not present strain relaxation processes, in the case of long nanowires, the whole structure observed in the bending and torsion profiles is now mirrored in the energy distribution along the nanowire length. We evaluated the energy losses from the point where the relaxation starts up to where the relaxation dips, which can be seen in Figure 2d. The energy accumulated in a nanowire is usually released by the generation of dislocation networks (17). To calculate the dislocation density in a nanowire, we consider that both the bending (ΔEbending) and torsion (ΔEtorsion) energies in the nanowire are practically consumed through the forma- tion of screw and edge threading dislocations. The full derivation of the screw and edge threading dislocation density was presented in (14) and it is not presented here. Finally, it was found that the screw threading dislocation density (3.64 × 107 cm-2) is higher than the edge one (8.48 × 106 cm-2). These results indicate that the number of dislocations running across the nanowires, generated by tilt relaxation, is higher than the number running along the nanowires, that it is according to theoretical investigations made in the framework of the elastic theory of cylindrical thin rods (17).
Conclusions
We showed the ability of grazing-incidence X-ray diffraction at different incidence angles to give us reliable information about bending and torsion profiles, as well to help improve our understanding of the strain relaxation processes, in highly dense nanowire arrays. Grazing incidence X-ray diffraction investigations were realized on the asymmetric (111) reflection at different incidence angles, allowing us to vary the X-ray penetration depth from tens of nanometers up to 10 micrometers, corresponding to the array’s length.
References
(1) R.B. Lewis, P. Corfdir, H. Kupers, T.Flissikowski, O.Brandt, and L. Geelhaar, NanoLett. 18, 2343–2350 (2018).
(2) A. Davtyan, D. Kriegner, V. Holy, A. AlHassan, R.Lewis, S. McDermott et al., J. Appl. Crystallogr. 53, 1310–1320 (2020).
(3) A.A. Hassan, W.A. Salehi, R.B. Lewis, T. Anjum, C. Sternemann, L. Geelhaar, and U. Pietsch, Nanotechnol. 32, 205705 (2021).
(4) J. Wallentin, D. Jacobsson, M. Osterhoff, M.T. Borgstrom, and T. Salditt, NanoLett. 17, 4143–4150 (2017).
(5) K.L. Kavanagh, I. Saveliev, M. Blumin, G. Swadener, and H.E. Ruda, J. Appl. Phys. 111, 044301 (2012).
(6) N. Begum, M. Piccin, F. Jabeen, G. Bais, S. Rubini, F. Martelli, and A.S. Bhatti, J. Appl. Phys. 104, 104311 (2008).
(7) Y. Chen, B. Peng, and W. Wang, J. Phys. Chem. C 111, 5855–5858 (2007).
(8) B. Jenichen, O. Brandt, C. Pfuller, P. Dogan, M. Knelangen, and A. Trampert, Nanotechnology 22(29), 295714 (2011).
(9) T. Stankevic, E. Hilner, F. Seiboth, R. Ciechonski, G. Vescovi, O. Kryliouk, U. Johansson, L. Samuelson, G. Wellenreuther, G. Falkenberg, R. Feidenhans’l, R., and A. Mikkelsen, ACS Nano. 9, 6978–698 (2015).
(10) H.V. Stanchu, A.V. Kuchuk, V.P. Kladko, M.E. Ware, Y.I. Mazur, Z.R. Zytkiewicz, A.E. Belyaev, and G.J. Salamo, Nanoscale Res. Lett. 11, 81 (2016).
(11) D. van Treeck, G. Calabrese, J.J.W. Goertz, V.M. Kaganer, O. Brandt, S. Fernandez-Garrido, S, and L. Geelhaar, Nano Res. 11, 565–576 (2018).
(12) T. Auzelle, X. Biquard, E. Bellet-Amalric, Z. Fang, H. Roussel, A. Cros, and B. Daudin, J. Appl. Phys. 120, 225701 (2016).
(13) D. Grigoriev, S. Lazarev, P. Schroth, A.A. Minkevich, M. Kohl, T. Slobodskyy, M. Helfrich, D.M. Schaadt, T. Aschenbrenner, D. Hommel, and T. Baumbach, J. Appl. Crystallogr. 49, 961–967 (2016).
(14) C. Romanitan, M. Kusko, M. Popescu, P. Varasteanu, A. Radoi, and C. Pachiu, J. Appl. Crystallogr. 52, 1077–1086 (2019).
(15) C. Romanitan, I. Mihalache, O. Tutunaru, and C. Pachiu, J. Alloy Compd. 858, 157723 (2021).
(16) C. Romanitan, P. Varasteanu, D. Culita, A. Bujor, O. Tutunaru, J. Appl. Crystallogr. 54, 847–855 (2021).
(17) V.M. Kaganer, B. Jenichen, and O. Brandt, Phys. Rev. Appl. 6, 064023 (2016).
Cosmin Romanitan is with the National Institute for Research and Development in Microtechnology in Voluntari, Romania. Direct correspondence to: cosmin.romanitan@imt.ro
Total Reflection X-ray Fluorescence Spectrometry (TXRF) as a Prospective Method for the Multielement Analysis of Apatite Crystals
Artem S. Maltsev, Alexei V. Ivanov, and Galina V. Pashkova, Institute of the Earth’s Crust, Irkutsk, Russian Federation
The elemental analysis of apatite minerals is an important study that is utilized in various applications in geology, biology, medicine, agriculture, technology, and environmental remediation. Two new methods for fast and cost-efficient multielement analysis of apatite samples by total reflection X-ray fluorescence (TXRF) spectrometry have been developed. The first method was used for the apatite samples to solve the “provenance” geological task. The second was developed for analyzing microcrystals of apatite with a size of 50–60 μm, focusing on uranium. Determining the uranium concentration in apatite microcrystals is the prerequisite of the fission-track dating technique. Sample preparation strategies, quantitative analysis procedures, and an accuracy assessment for both TXRF methods have been considered. The advantages of TXRF spectrometry in comparison to other analytical methods are also discussed.
Apatite, Ca5(PO4)3(F, Cl, OH), is among the most common minerals on Earth and is found in many sedimentary, metamorphic, and igneous rocks (1). Besides possessing a high content of calcium and phosphorous, apatite minerals are also rich in the rare earth elements strontium, uranium, and thorium, the quantification of which can be used for provenance analysis (matching sediments to their source igneous and metamorphic rocks) and petrology (deciphering genesis of these rocks) genesis deciphering in geology (2). Uranium in apatite is important because knowledge of its concentration is a prerequisite for fission-track dating (3). Laser-ablation inductively coupled plasma–mass spectrometry (LA-ICP–MS) is the most common technique for the elemental analysis of apatite (4). However, that technique is not cost-efficient. Other analytical techniques, such as electron probe X-ray microanalysis (5) and wavelength dispersive X-ray fluorescence spectrometry (6), are either not sensitive enough or require large-mass samples. Therefore, we utilized TXRF spectrometry because it is rapid and cost-effective, and has the capability to analyze a very small mass of material (tens of micrograms) (7).
Materials and Methods
The TXRF analysis of apatite samples was performed using a S2 Picofox spectrometer (Bruker Nano) equipped with a Moanode X-ray tube (working conditions are 50 kV and 0.75 mA). Measurements were carried out during a 500 s period. The following reagents and materials were used: Concentrated nitric acid (suprapure grade, Merck) and ultrapure deionized water (18.2 MΩ, Elga Labwater) were used for the sample preparation; quartz carriers served as sample holders; and the Durango reference material was used for a trueness assessment. TXRF was applied to the apatite samples from the Slyudyanka metamorphic complex (Siberia), which is famous for its mineralogical versatility (8) and Tanzibei (9) complex (Altai).
Results and Discussion
Based on previous papers dedicated to TXRF analysis of geological objects, there are two main sample preparation techniques: suspension and acid digestion. The suspension preparation requires a careful milling procedure with a final particle size of less than <10 μm, which is difficult if only a small sample amount is available. The acid digestion procedure is more suitable for analyzing apatite crystals. The sample preparation technique for the bulk-type apatite was optimized as follows: 5–10 mg of the ample was mixed with 100 μL of HNO3 in a closed PTFE vessel and heated at 160 °C for 30 min; the obtained solution was diluted with 800 μL of ultrapure H2O and 100 μL of the internal standard of gallium.
For a micro-sized sample of apatite (crystals with a mass of approximately a few tens of micrograms), we prepared the specimen straight on the carrier because of the inability to reproduce the aforementioned sample preparation technique with such a small sample. A single crystal of apatite was carefully placed onto the center of the presiliconized quartz carrier under the microscope. Then, 500 nL of concentrated nitric acid was deposited over the crystal, and the carrier was heated at a gradually increasing temperature (90 °C) to obtain a well-distributed specimen. Ultrapure water of approximately 1 μL was added next to dissolve the calcium salts, and the specimen was dried again. Using Raman spectroscopy allowed us to study the formations of the minerals and their distribution within the crystal. Because of the homogeneous distribution of phosphorous in the specimen, its stoichiometric value was used as an internal standard (equal to 170 ± 10 g/kg) for the quantitative analysis.
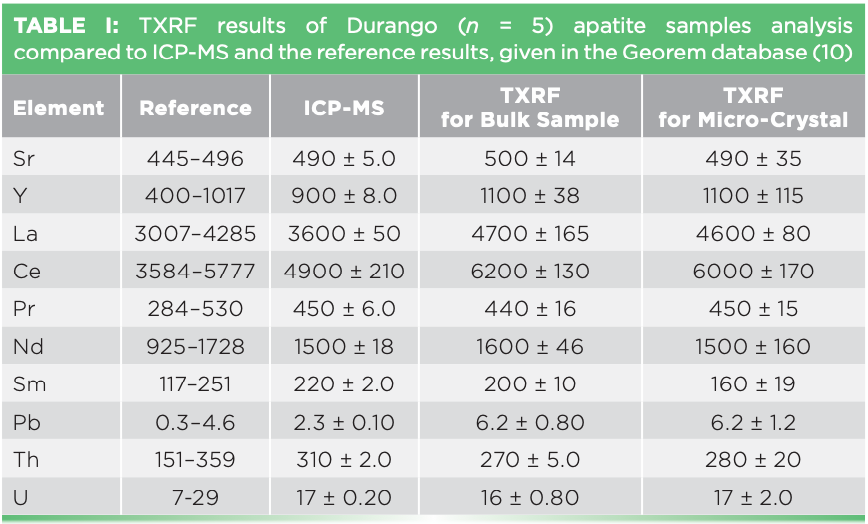
The Durango reference material was analyzed to assess the trueness of two TXRF methods. Because the reference material is not certified, ICP-MS analysis was conducted for validation purposes. Table I presents both the TXRF and ICP-MS results and reference values of Durango apatite (10), expressed by the average concentration values with associated standard deviations. Results of both TXRF methods for most elements align with the ICP-MS and reference values. The detection limits of TXRF for bulk samples were in a range between 0.1 and 0.7 mg/kg. For the microcrystals, the detection limits ranged between 1.0 and 20 mg/kg. Some deviations in the results may have been caused by the inhomogeneity of the apatite sample, especially in the case of the microcrystal analysis.


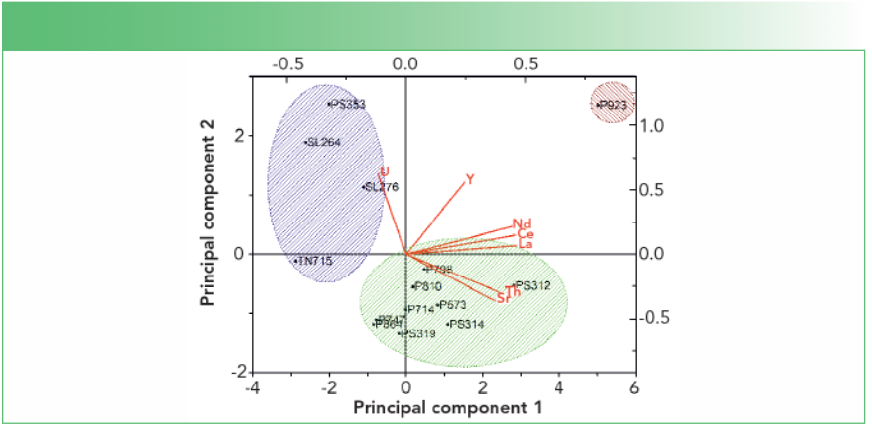
The TXRF method for bulk samples was applied to the apatite minerals from the Slyudyanka complex and the results were processed by principal component analysis (PCA). Figure 1 shows the three main groups of apatite minerals that differ by their genesis. The results of PCA are fully consistent with the geochemical data of the samples.


FIGURE 1: PCA results based on the element composition of apatite samples from Slyudyanka. Three apatite groups were obtained by their genesis: The metamorphic group is highlighted in blue; the hydrothermal-metasomatic group is highlighted in green; and P923 is apatite of carbonate-silicate rocks.
The TXRF method for microcrystals of apatite is currently under consideration to apply to determining uranium for the fission track dating. The 16 microcrystals of apatite from the Tanzibei complex were analyzed for uranium by TXRF and LA-ICP-MS. The concentration values of uranium were found between 3.0 and 155 mg/kg. A good convergence of results was obtained, expressed by the correlation coefficient r2 = 0.9932, and the average recovery value 96 ± 13%. Some results obtained by the methods were not agreed upon, which might be caused by the dissimilarity between the two methods. The LA-ICP-MS is a local method and the measurement takes place at an ablation pit of ~20–30 μm of the crystal, unlike TXRF, where the whole crystal is under analysis.
Conclusion
Considering the advantages of TXRF compared to the routine methods of apatite analysis, including rapidity, cost-efficiency, and simplicity of performance, the proposed methods may be an excellent tool for apatite-involving applications.
Acknowledgments
The study was conducted in the frame of the grant of the Ministry of Science and High Education of the Russian Federation (Grant number: 075-15-2019-1883). The research was performed using the equipment of joint-use center Geodynamics and Geochronology at the Institute of the Earth’s Crust SB RAS. The authors are grateful to S. Panteeva for the ICP-MS analysis, A. Marfin for the Raman spectroscopy analysis, and L. Reznitskii and Yu. Bishaev for providing the samples.
References
(1) Apatite: Mineral information, data and localities, Mindat.org. http://mindat.org/min-29229.html (accessed June 02, 2021).
(2) A. Zirner, M.A.W. Marks, T. Wenzel, D.E. Jacob, and G. Markl, Lithos 228–229, 12–22 (2015). https://doi.org/10.1016/j.lithos.2015.04.013.
(3) E.A. Belousova, W.L. Griffin, S.Y. O’Reilly, and N.I. Fisher, J. Geochem. Explor. 76, 45–69 (2002). https://doi.org/10.1016/ S0375-6742(02)00204-2.
(4) D.M. Chew, M.G. Babechuk, N. Cogne, C. Mark, G.J. O’Sullivan, I.A. Henrichs, D. Doepke, and C.A. Mckenna, Chem. Geol. 435, 35–48 (2016). https://doi.org/10.1016/j.chemgeo.2016.03.028.
(5) H. Teiber, M.A.W. Marks, A.A. Arzamastsev, T. Wenzel, and G. Markl, J. Min. Geochem. 192, 151–167 (2015). https://doi.org/10.1127/njma/2015/0277.
(6) L. Muia and R. Van Greeken, Anal. Chim. Acta 251, 177–181 (1991). https://doi.org/10.1016/0003-2670(91)87132-Q.
(7) A.S. Maltsev, A.V. Ivanov, V.M. Chubarov, G.V. Pashkova, S.V. Panteeva, L.Z. Reznitskii, Talanta 214, 120870 (2020). https://doi.org/10.1016/j.talanta.2020.120870.
(8) J. De Grave, E. De Pelsmaeker, F.I. Zhimulev, S. Glorie, M.M. Buslov, and P. Van den haute, Tectonophysics 621, 44–59 (2014). https://doi.org/10.1016/j.tecto.2014.01.039.
(9) Slyudyanka Lake Baikal area, Irkutsk Oblast, Russia, https://www.mindat.org/loc2719.html (accessed June 02, 2021).
(10) K.P. Jochum, U. Nohl, K. Herwig, E. Lammel, B. Stoll, and A.W. Hofmann, Geostand. Geoanal. Res. 29, 333–338 (2005). https://doi.org/10.1111/j.1751908X.2005.tb00904.x.
Artem S. Maltsev, Alexei V. Ivanov, and Galina V. Pashkova are with the Institute of the Earth’s Crust in Irkutsk, Russian Federation. Direct correspondence to: artemmaltsev1@gmail.com
Using X-Ray Fluorescence Spectroscopy to Overcome the Challenge of Tracing the Transport of Fertilizers in Plants and Quickly Diagnosing Nutritional Status
Thainara Rebelo da Silva, Gabriel Sgarbiero Montanha, Camila Graziele Corrêa, João Paulo Rodrigues Marques, and Hudson Wallace Pereira de Carvalho Laboratory of Nuclear Instrumentation, Center for Nuclear Energy in Agriculture, University of São Paulo, São Paulo, Brazil
X-ray fluorescence (XRF) spectroscopy can be used to analyze the distribution and fate of fertilizers applied to plant leaves (foliar fertilization). Our group has been developing methods to adapt commercial and in-house-built portable systems to quantify, in the field, several mineral nutrients in major crops such as soybean, maize, and coffee by nondestructive and in vivo analysis. Additionally, XRF microanalysis has been applied to investigate the biofortification of grains and the foliar uptake of fertilizers. In this approach, XRF techniques can describe the anatomical distribution of minerals in tissue. These studies have demonstrated that XRF spectroscopy is a valuable technique for plant nutrition diagnosis and metallomics studies. Additionally, it is a powerful tool to boost knowledge about how foliar fertilizers are absorbed, transported, and metabolized by plants.
For thousands of years, agriculture and forestry have supplied us with food, feed, fiber, energy, and materials. More recently, they also have been responsible for providing renewable fuels, such as ethanol, which corresponds approximately to 68% of biofuel produced worldwide (1). In addition, concerns related to climate change and possible oil scarcity push agriculture to produce platform molecules for the chemical industry. Combined with the still-growing world population and increasing living standards, these factors lead to pressure for greater agriculture output. Rather than increasing the planted area, the wiser way of responding to these demands is by augmenting productivity.
Agricultural productivity is a complex function dependent on several factors, one of which is plant mineral nutrition. In addition to carbon, hydrogen, and oxygen, plants require 14 other mineral nutrients (2). Maintaining adequate levels of such nutrients is a key part of the productivity equation. Because these nutrients may be found in low concentrations in soils and are depleted after each crop season, they must be resupplied in the form of fertilizers.
Although soil broadcasting is the most common fertilization method, it is not necessarily the most effective way to deliver certain nutrients to plants. Depending on physical, chemical, and biological conditions of the soil, nutrients may not be readily available to plants (3). As a result, alternative methods such as foliar fertilization and seed treatment can be more adequate to alleviate plant deficiencies. For example, foliar fertilization of iron is a significantly more efficient method than using soil application methods for plants growing in iron-deficient calcareous soils (4).
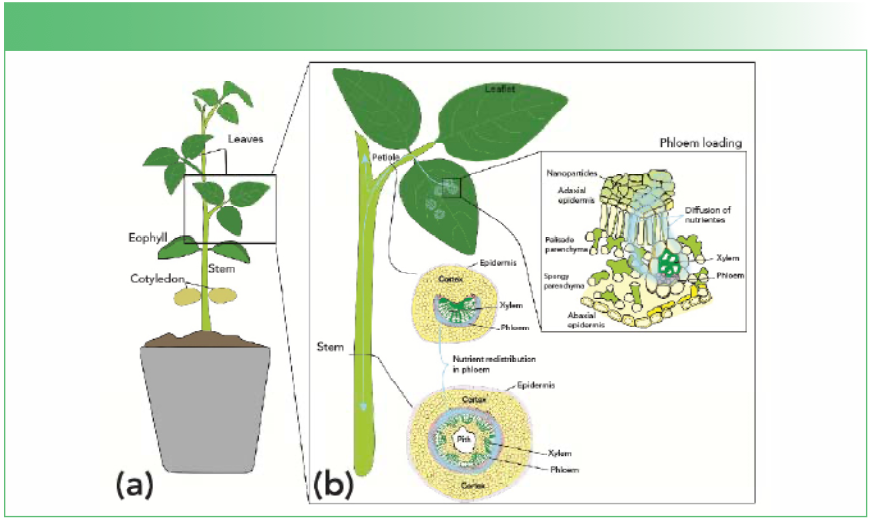
Foliar fertilizers can be absorbed by the epidermal cuticles and stomata (pores) of leaves and move through diffusion to reach the phloem tubes where they are loaded and translocated first to the petiole before traveling to other parts of the plant (5,6). This process is illustrated in Figure 1.

 aerial part of plant and organs, and (b) close-up of nutrient flow in plant structures: absorption and translocation of foliar-applied nutrients.")
FIGURE 1: (a) aerial part of plant and organs, and (b) close-up of nutrient flow in plant structures: absorption and translocation of foliar-applied nutrients.
However, leaf tissues are quite complex, and this process may vary across different species and environmental conditions. As a result, tracing the fate of mineral nutrients applied to leaves can be challenging (7).
X-ray fluorescence (XRF) spectroscopy techniques enable the detection of most mineral nutrients. However, it is worthy to note that elemental sensitivity depends on the atomic number; therefore, the limits of detection vary from one element to another. Elements such as phosphorus, sulfur, potassium, and calcium are easily detected because they are present in vegetal tissue at concentration ranges that vary from hundreds to few thousand mg/kg, whereas micronutrients, such as manganese, iron, copper, zinc, and molybdenum, are more challenging despite their higher XRF yield because they are present at lower concentration ranges, usually from a few tens to few hundred mg/kg. Conversely, detecting magnesium, which is present at relatively high concentration in plant tissues, is difficult because of its low atomic number. Magnesium detection is facilitated under vacuum or helium atmospheres. The detection of elements, such as nitrogen and boron, is not practical.
Benchtop energy-dispersive XRF equipment operating with 50 W anodes and ~45o geometry competes with atomic absorption spectroscopy (AAS) for conventional laboratory-based foliar diagnosis of nutritional status. In this case, in the powdered tissue of leaf, root, seed, or stem material, nutrients can be quantified without sample digestion (8). Therefore, despite presenting higher limits of detection, XRF may be suitable for this application since it offers the benefits of higher speed and lower cost compared to AAS.
In conventional laboratory-based foliar diagnosis, farmers randomly collect a specific number of leaves that represent a determined crop plot. The leaves are then sent to the laboratory where they are washed, dried, ground, digested, and ultimately analyzed by atomic or molecular spectroscopy. The whole process may take from a couple of days up to a few weeks. However, the time window for detecting and correcting nutritional deficiencies in annual crops, such as soybean, maize, rice, wheat, and tomatoes, is short. For example, two weeks between shipping leaf samples and obtaining results is too long.
For this reason, our group has been developing a strategy to perform foliar diagnosis under field conditions. For this work, we have employed both commercial handheld equipment and in-house built portable systems. The key instrumental features are a short X-ray beam path, or the use of a vacuum, for analyzing macronutrients, and primary filters for analyzing micronutrients. Currently, within a few minutes, it is possible to quantify phosphorus, sulfur, calcium, potassium, manganese, iron, and zinc in soybean fields with the same accuracy and precision offered by conventional laboratories (9, and additional unpublished results). The method is currently being tested for coffee trees and maize, and efforts are being made to extend the number of detectable elements.
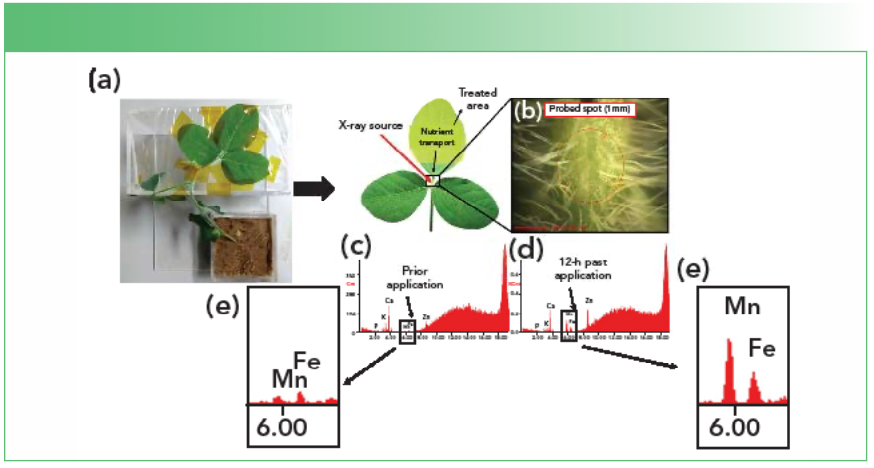
Additionally, XRF spectroscopy has been employed to investigate the up- take and transport of mineral nutrients in plants (10). Figure 2 presents the sample holder used for benchtop equipment for the in vivo XRF determination of foliar fertilizer absorption on soybean petioles. The X-ray beam spot size at millimeter range provided pinholes and collimators to precisely irradiate the desired tissues. We developed methods that allow the tracing the foliar (11–13) and root absorption (14–16), as well as short- and long-distance transport at the petiole and stem, respectively. It means that one can determine the uptake rate of nutrients without using radioisotopes, which compares the performance of commercially available products and supports the development of more efficient nutrient sources. In this context, one has to be careful to avoid induced X-ray beam radiation damage to plant tissues. Irradiation with a nonfocused beam provided by anodes operating at 40.5 W for up to 60 min of exposure did not cause any detectable damage (17).

 for the in vivo XRF determination of foliar fertilizer absorption on soybean petioles (b-c). A main advantage of the in vivo analysis is the possibility of conducting time-resolved experiments (d–e) that enable real-time assessment of the absorption phenomena.")
FIGURE 2: Representation of the setup employed (a) for the in vivo XRF determination of foliar fertilizer absorption on soybean petioles (b-c). A main advantage of the in vivo analysis is the possibility of conducting time-resolved experiments (d–e) that enable real-time assessment of the absorption phenomena.
Finally, XRF spectroscopy can also produce chemical images that reveal the spatial distribution of elements. Capillary optics are capable of focusing down the X-ray beam, which offers both high flux density and lateral resolution. This tool supports studies that unravel the pathways of nutrients within plant tissue and reveal nutrients’ fate. An interesting case study addressed the biofortification of food with selenium. This element is not essential for plants, but it is essential for animals. Most of the human population lives with selenium deficiency. Hence, with our collaborators, we have been trying to increase the content of selenium in staple foods such as rice and cowpeas. Chemical images of selenium and other elements show that most mineral nutrients are concentrated in the seed coat of cowpea (18) and in the aleurone layer (bran and embryo) of rice (19, 20). Hence, biofortification strategies will only be effective if the desired nutrients are incorporated into the endosperm, which is the most widely consumed part of grains.
XRF spectroscopy has enormous potential for applications in agriscience. Because it is mostly unknown in this scientific community, we have to continue intensive work to advertise it. A key advantage of XRF spectroscopy for such applications is its low level of invasiveness, which allows it to be combined with plant sensors such as infrared gas analyzers, fluorimetry to detect organic molecules, and electrodes for electrophysiological responses (17).
References
The XRF facilities were funded by the São Paulo Research Foundation’s (FAPESP) multi-user equipment pro- gram (grant 2015-19121-8) and Financiadora de Estudos e Projetos” (FINEP) within the “Core Facility de suportes às pesquisas em Nutrologia e Segurança Alimentar na USP” project (grant number 01.12.0535.0). T.R.S. is founded by the Coordenação de Aperfeiçoamento de Pessoal de Nível Superior–Brasil (CAPES)–Finance Code 001 (grant 88887.498165/2020- 00). G.S.M. receives a São Paulo Research Foundation’s PhD scholarship (grant 20/07721-9). C.G.C receives a scholarship funded by Ubyfol (grant 10394-0). H.W.P. Carvalho is the recipient of a research productivity fellowship from the Brazilian National Council for Scientific and Technological Development (CNPq) (grant 306185/2020-2). The authors acknowledge M.H.F. Gomes, T.M. Soares, and B.A. Machado for some of the pictures of the XRF equipment.
References
(1) IEA–International Energy Agency, Transport Biofuels – Renewables 2020 – Analysis (IEA, Paris, 2020).
(2) E. Kirkby, in Marschner’s Mineral Nutrition of Higher Plants (Academic Press, 3rd ed., 2012), pp. 3–5.
(3) V.D. Fageria, J. Plant Nutr. 24(8), 1269–1290 (2001). DOI:10.1081/PLN100106981.
(4) N.K. Fageria, M.P. Barbosa Filho, A. Moreira, and C.M. Guimarães, J. Plant Nutr. 32(6), 1044–1064 (2009). DOI:10.1080/01904160902872826.
(5) T.A.B. Fenilli, K. Reichardt, O.O.S. Bacchi, P.C.O. Trivelin, and D. Dourado-Neto, An. Acad. Bras. Ciênc. 79(4), 767–776 (2007). DOI:10.1590/S00013765007000400015.
(6) V. Fernández and P.H. Brown, Front. Plant Sci. 4, 289 (2013). DOI: 10.3389/fpls.2013.00289.
(7) V. Fernández, E. Gil-Pelegrín, and T. Eichert, Plant J. 105(4), 870–883 (2021). DOI: 10.1111/tpj15090.
(8) E. de Almeida, N.M. Duran, M.H.F. Gomes, S.M. Savassa, T.N.M. da Cruz, R.A. Migliavacca, and H.W.P. de Carvalho, X-Ray Spectrometry 48(2), 151–161 (2019). DOI: 10.1002/xrs.3001.
(9) G.T. Costa Junior, L.C. Nunes, M.H.F. Gomes, E. de Almeida, and H.W.P. de Carvalho, X-Ray Spectrometry 49(2), 274–283 (2020). DOI: 10.1002/xrs.3111.
(10) E.S. Rodrigues, M.H.F. Gomes, N.M. Duran, J.G. Cassanji, T.N.M. da Cruz, A.S. Neto, S.M. Savassa, E. de Almeida, H.W.P. de Carvalho, Front. Plant Sci. 9, 1588 (2018). DOI: 10.3389/fpls.2018.01588.
(11) M.H.F. Gomes, B.A. Machado, J.P.R. Marques, R. Otto, T. Eichert, and H.W.P. de Carvalho, J. Soil Sci. Plant 20(4), 2721–2739 (2020). DOI: 10.1007/s42729-020-00338-3.
(12) B.A. Machado, M.H.F. Gomes, J.P.R. Marques, R. Otto, and H.W.P. de Carvalho, J. Agric. Food Chem. 67(47), 13010–13020 (2019). DOI: 10.1021/acs.jafc.9b05630.
(13) M.H.F. Gomes, B.A. Machado, E. de Almeida, G.S. Montanha, M.L. Rossi, R. Otto, F.S. Linhares, and H.W.P. de Carvalho, J. Agric. Food Chem. 67(44), 12172–12181 (2019). DOI: 10.1021/acs.jafc.9b04977.
(14) T.N.M. da Cruz, S.M. Savassa, M.H.F. Gomes, E. dos Santos, N.M. Duran, E. de Almeida, A.P. Martinelli, and H.W.P. de Carvalho, Environ. Sci. 4(12), 2367–2376 (2017). DOI: 10.1039/C7EN00785J.
(15) T.N.M. da Cruz, S.M. Savassa, G.S. Montanha, J.K. Ishida, E. de Almeida, S.M. Tsai, J. Lavres Junior, and H.W.P. de Carvalho, Sci. Rep. 9(1), 10416 (2019). DOI: 10.1038/s41598-019-46796-3.
(16) G.S. Montanha, E.S. Rodrigues, S.L.Z. Romeu, E. de Almeida, A.R. Reis, J. Lavres Junior, and H.W.P. de Carvalho, Plant Sci. 292, 110370 (2020). DOI: 10.1016/j.plantsci.2019.110370.
(17) G.S. Montanha, E.S. Rodrigues, J.P.R. Marques, E. de Almeida, A.R. Reis, and H.W.P. de Carvalho, Metallomics 12(2), 183–192 (2020). DOI: 10.1039/C9MT00237E.
(18) M.G.D.B. Lanza, V.M. Silva, G.S. Montanha, J. Lavres, H.W.P. de Carvalho, and A.R. dos Reis, Ecotoxicol. Environ. Saf. 207, 111216 (2021). DOI: 10.1016/j.ecoenv.2020.111216.
(19) A.R. Reis, E.H.M. Boleta, C.Z. Alvez, M.F. Cotrim, J.Z. Barbosa, V.M. Silva, R.L. Porto, M.G.D.B. Lanza, J. Lavres, M.H.F. Gomes, and H.W.P. de Carvalho, Ecotoxicol. Environ. Saf. 190, 110147 (2020). DOI: 10.1016/j.ecoenv.2019.110147.
(20) J.H.L. Lessa, J.F. Raymundo, A.P.B. Corguinha, F.A.D. Martins, A.M. Araujo, F.E.M. Santiago, H.W.P. de Carvalho, L.R.G. Guilherme, and G. Lopes, J. Cereal Sci. 96, 103125 (2020). DOI: 10.1016/j.jcs2020.103125.
Thainara Rebelo da Silva, Gabriel Sgarbiero Montanha, Camila Graziele Corrêa, João Paulo Rodrigues Marques, and Hudson Wallace Pereira de Carvalho are with the Laboratory of Nuclear Instrumentation in the Center for Nuclear Energy in Agriculture at the University of São Paulo in São Paulo, Brazil. Direct correspondence to: hudson@cena.usp.br
Click this link to access the full "Recent Developments in X-ray Analysis" article in a PDF format.


Newsletter
Get essential updates on the latest spectroscopy technologies, regulatory standards, and best practices—subscribe today to Spectroscopy.