Publication
Article
Spectroscopy
An X-ray Fluorescence (XRF) Analysis of a Molecular Layer Deposition (MLD) Method Used in Producing Cement from Phosphogypsum
Author(s):
To supervise the quality of new cement, it is necessary to constantly update the monitoring and testing methods of the cement composition. The molecular layer deposition (MLD) method is an X-ray fluorescence (XRF) analysis method that can scrutinize a glass frit of an unknown dilution ratio. In this study, the method of preparing a glass frit of cement from phosphogypsum for XRF analysis by the MLD method was reviewed, and the working curve suitable for XRF analysis of the cement from phosphogypsum was established. The proposed analysis steps of a glass frit can be widely used in factories that produce cement from phosphogypsum.
The new cement product produced by the production process of sulfuric acid integrated with cement from phosphogypsum (1,2) has been widely used in the market. Phosphogypsum is the solid waste that is produced by sulfuric acid decomposing the phosphate rock in the process of phosphoric acid production by phosphorus chemical enterprises. Because of the harmful impurities and high purification cost of phosphogypsum, its effective use has become a major problem (3). Nowadays, the accumulation of phosphogypsum in China has reached 500 million tons, and nearly 80 million tons of phosphogypsum are newly produced each year. The utilization of large-scale solid waste resources of phosphogypsum can reduce the environmental and safety risks brought by the massive accumulation of phosphogypsum, which is significant for the protection of the Yangtze River Economic Belt and the safety of China’s grain production. Nowadays, phosphogypsum is used to produce cement clinker, which is an effective way to consume phosphogypsum (4).
The production of sulfuric acid with the co-production of cement from phosphogypsum is an effective measure to solve the problem of utilizing phosphogypsum. This project digests a large amount of phosphogypsum and balances the consumption of sulfuric acid in the production of ammonium phosphate, which is a sustainable method (5). When producing cement clinker from phosphogypsum, gypsum instead of limestone is used to prepare raw meal, and a reducing agent coke is required. The resulting prepared raw meal is called raw meal with phosphogypsum. During the cement production, the addition of an appropriate amount of reducing agent carbon promotes the decomposition of calcium sulfate in the raw meal into calcium oxide for producing cement clinker and sulfur trioxide for producing sulfuric acid. Adding the reducing agent carbon increases the difficulty of X-ray fluorescence (XRF) analysis of the raw meal, so it is necessary to explore the preparation method of the glass frit, which is suitable for raw meal with phosphogypsum.
The molecular layer deposition (MLD) method is a new XRF analysis method, which overcomes the drawbacks that the XRF analysis is subject to. The chemical method preparation of standard samples and the prepared glass frit reduces the dependence on the preparation equipment quality, the flux quality, and the technical level requirements of personnel (6).
In this experiment, the MLD method was used to analyze the raw meal with phosphogypsum. However, because of the presence of carbon, the high temperature burning of the sample causes a large amount of sulfate decomposition loss in the preparation of the glass frit, resulting in a large error in the analysis of the sulfur content. Therefore, the method of preventing pyrolysis of sulfate during the fusion process was studied, and a suitable method for preparing the glass frit for raw meal with phosphogypsum samples was proposed. At the same time, the corresponding standard samples were prepared, and the analytical method was established. It is known from our work that the glass frit preparation method proposed in this study to analyze raw meal with phosphogypsum has good accuracy, and the analysis time is greatly reduced.
Experimental
Instrument and Reagent
For this study, we utilized a S8 Tiger X-ray fluorescence spectrometer from Bruker; a high-temperature furnace (working temperature: 600–700 °C, and 950–1000 °C) from Platinum; ammonium nitrate; and, for the analysis, special reagent lithium tetraborate and lithium metaborate was used in a 33:67 ratio along with 30% of the release agent ammonium iodide.
Preparation of Fused Bead Sample
The loss on ignition refers to the amount of carbon dioxide, moisture, fixed carbon in the coal, and organic compounds lost (volatilized) in the sample at high temperatures. For the loss on ignition of conventional cement samples, it is only necessary to weigh the mass of the sample before and after burning it at 950 °C to 1000 °C. Calcium sulphate in the sample will decompose largely at 950 °C, which is because of reducing carbon in raw meal with phosphogypsum. Therefore, calculating the burning loss of the raw meal with the phosphogypsum sample requires the removal of the reducing agent carbon before reaching the decomposition temperature of the calcium sulfate. To cure the sulfur dioxide produced by the small amount of the decomposed calcium sulfate, it is also necessary to add a sulfur dioxide absorbent. In this study, the carbon was removed by oxidation with ammonium nitrate at 600 °C, and the sulfur dioxide is solidified with lithium borate (7).
Measurement of Loss on Ignition
For this experiment, 1.2 g of raw meal, 1.0 g of ammonium nitrate, and 6.0 g of flux (high-temperature treated) were mixed in a platinum crucible of known mass. The crucible was placed on the electric furnace and heated until the oxidant had completely evaporated. Thereafter, the crucible was transferred to a high temperature furnace at 600 °C and calcined for 10 min. Finally, the furnace was heated at 950 °C for 12 min. After cooling to room temperature, the total mass of raw meal and platinum crucible was weighed, and the loss on ignition of the raw meal was calculated according to equation 1. Three parallel measurements were made and the results of the loss on ignition are shown in Table I:

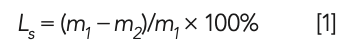


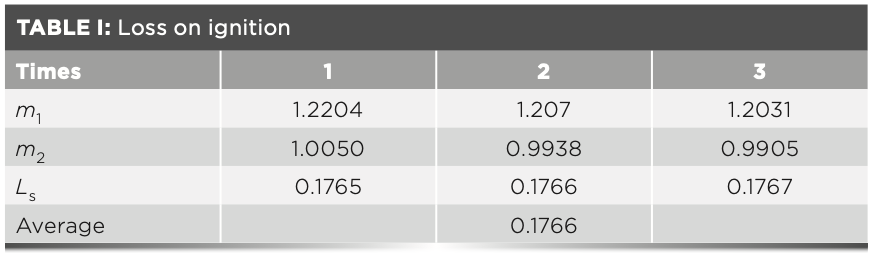

where Ls is the loss on ignition; m1 is the mass before the raw meal being burned; and m2 is the mass after the raw meal is burned at 980 °C.
Preparation of Glass Frit
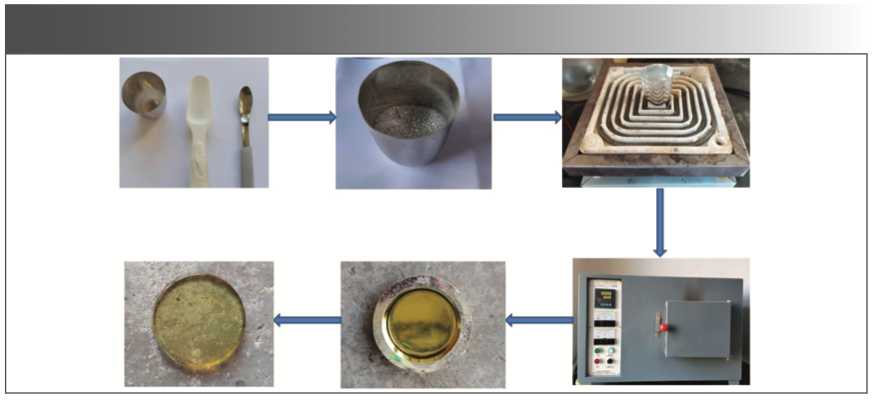
Two drops of the release agent were added to the glass frit in which the burning loss was measured. The crucible and the fused glass bead were placed in a high temperature furnace at 980 °C until the melt was completely molten. Then, the crucible was taken out and shaken to drive out the bubbles and make the melt completely uniform, and the platinum mold was reheated for 5 min in a high-temperature furnace. Finally, the sample was poured into a platinum mold and cooled to form a glass frit. The sample preparation process for the glass frit is shown in Figure 1.


FIGURE 1: Illustration of the process of sample preparation as described in the text.
Results and Discussion
Calibration Model and Curve
The working curve of the MLD method shows the relationship between the fluorescence intensity and the concentration of sample, which relates to the parameters such as the MLD coefficient, curve slope, and matrix correction coefficient between elements (8). In this study, the MLD coefficient was calculated by preparing the raw meal with phosphogypsum glass frit with different dilution ratios; the matrix correction coefficient αij between the elements is calculated by the theoretical calculation method (9), and only the main components of silica, aluminum oxide, ferric oxide, calcium oxide, and sulfur trioxide were subjected to matrix correction. The intensity–density conversion calculation is performed using the Lachance-Traill mathematical correction mode, that is shown in equation 2


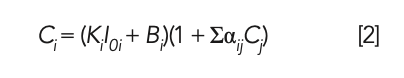
where Ci represents the concentration of the chemical component to be tested; Cj represents the concentration of coexisting chemical components; Ki represents the slope of the working curve; Bi represents the intercept of the working curve, also known as the background equivalent concentration (BEC); αij represents the coefficient of influence of the coexisting chemical component to be tested; and I0i indicates the intensity of the chemical component i to be measured in the fused glass bead when the dilution ratio of the sample to be tested is the same as that of the calibration sample (CS).
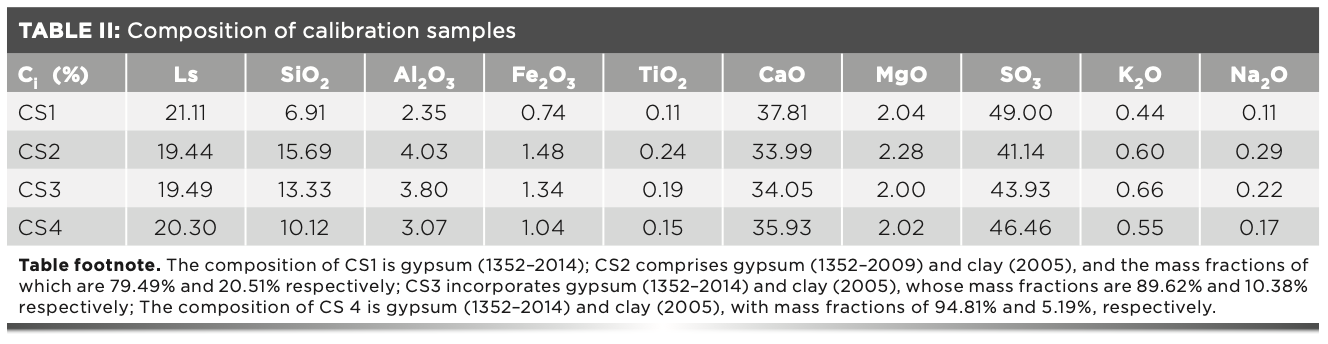
The intensity measured by the S8 Tiger instrument was the net intensity minus the background, at which time Bi = 0. In the experiment, four calibration samples were used to make the working curve (10). The mixed sample of gypsum and clay standard samples were used as the calibration samples. The gypsum ratios in the four calibration samples were about 100, 95, 90, and 80, respectively. The standard values of the four calibration samples are shown in Table II.


Ki was calculated by a regression analysis that measures the intensity of the calibration sample melted using the standard dilution ratio (11). The intensity of the fuse converted to the intensity of the standard dilution ratio by using equation 3 (12–14). The results of intensity that the three calibration samples measured three times in parallel at the standard dilution ratio are shown in Table III


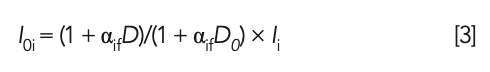

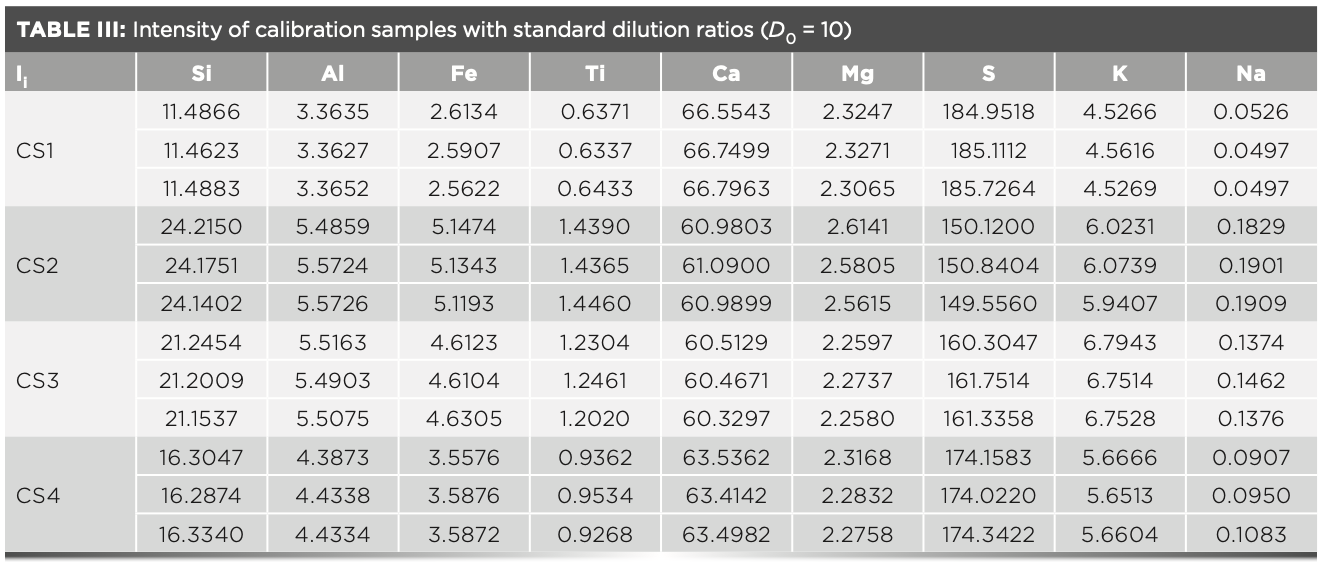

where αif represents the MLD coefficient; I0i represents the standard intensity of the glass frit; Ii represents the measured intensity of the glass frit; D represents the dilution ratio of the glass frit of the sample to be tested; and D0 represents the standard dilution ratio of the glass frit (D0 = 10).
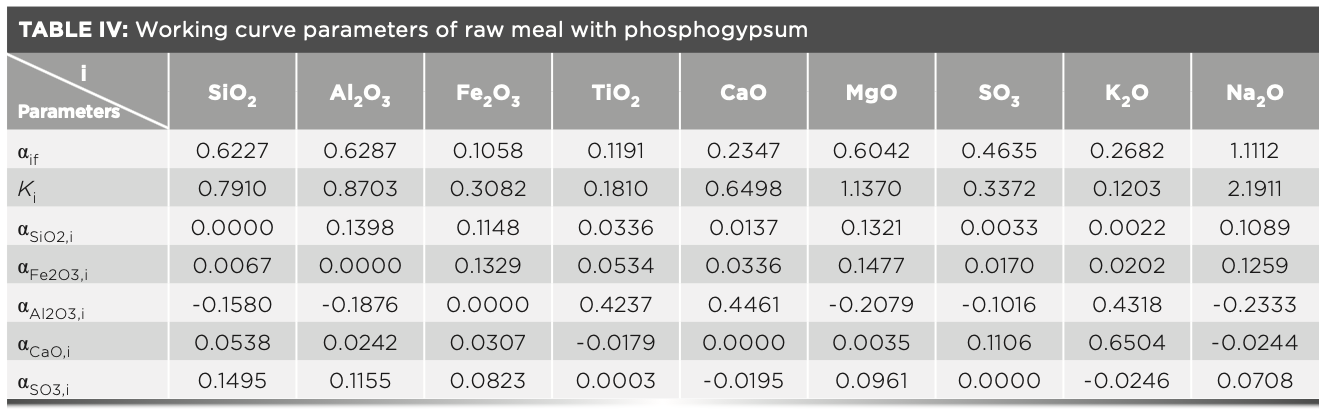
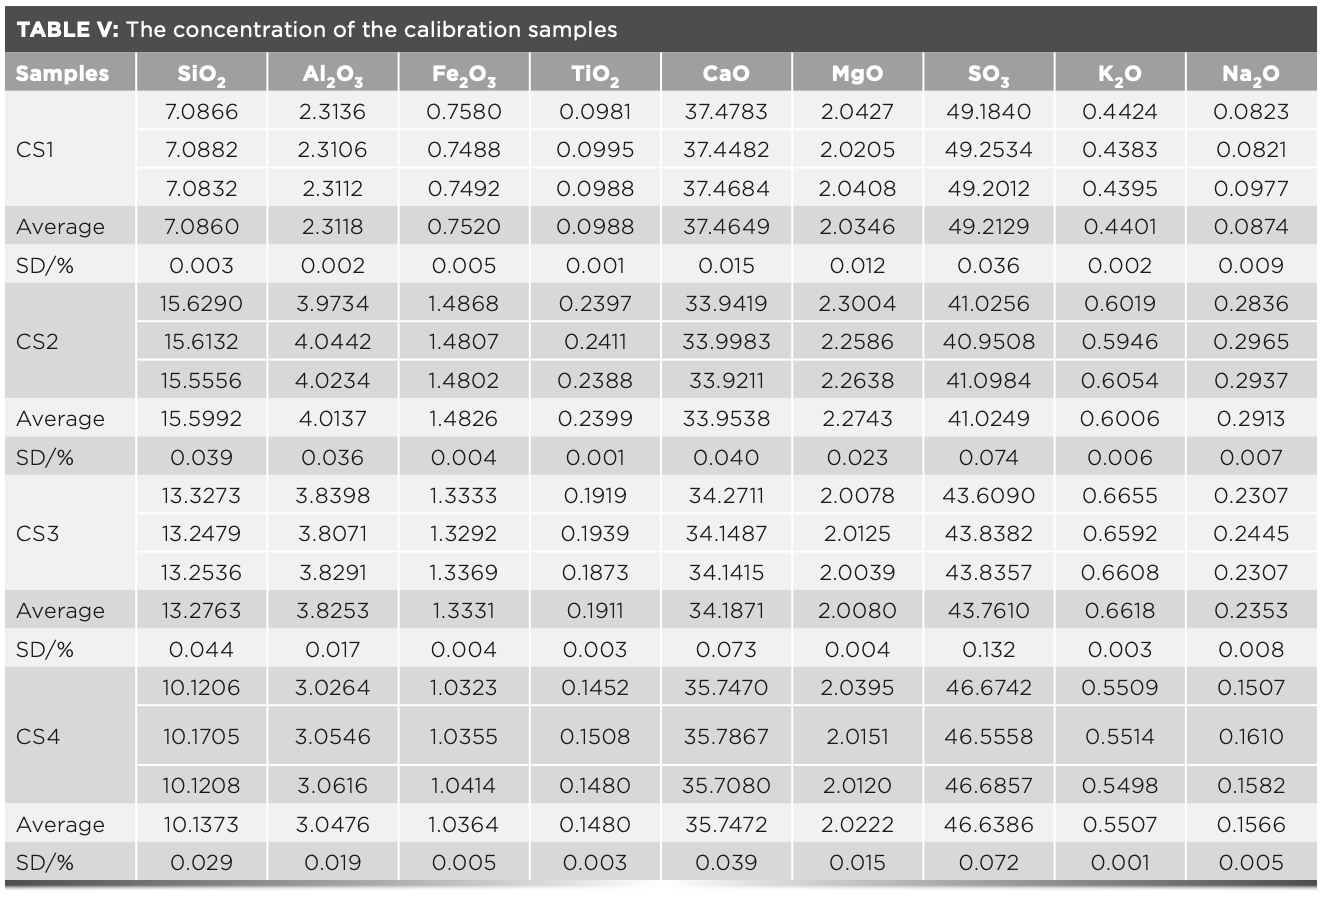
In the XRF analysis experiment, three crystals are used to measure the elements, which are the LiF200 crystal, the PET crystal, and the XS-55 crystal, respectively. The angle of the element in the spectrum is related to the atomic number; and the intensity of the element is proportional to the concentration. The analytical angle of each element in the raw meal is shown in Figure 2. The MLD coefficient calculated with raw meal and the slope Ki values calculated with the calibration samples are shown in Table IV. The concentration value of the prepared calibration samples were calculated according to the relevant parameters of the curve in Table IV, and the values are shown in Table V. Compared with the standard value (Table II), the deviations of the measured value (Table V) of the calibration samples are less than the limit specified by the standard, and the deviation of the results obtained in three parallel determinations is within the allowed range of the standard. Therefore, this method has excellent accuracy in determining the element content in cement.


Preparation of Actual Sample Foil
For this study, 1.2 g of raw meal with phosphogypsum, 1.0 g of oxidant, and 6.0 g of flux were added in a platinum crucible and stored evenly with a thin glass rod. The crucible was put on the electric furnace and baked for about 20 min until the oxidant was completely evaporated. After that, the crucible was transferred to a high temperature furnace at 600 °C and burned for 10 min. After cooling to room temperature, two drops of the release agent were added into the crucible. Finally, the crucible was placed in a high temperature furnace at 950 °C for 12 min before the crucible was taken out and shook to drive the bubbles, and a platinum mold was placed in a high temperature furnace for 5 min. The sample was poured into the platinum mold until cooling, and then the glass frit was made.
Measurement of Glass Frit and Conversion of Sample Concentration
The prepared glass frits were put into the instrument to measure the intensity of each measurable element in the sample, and the mass percentage of the sample chemical components (element oxides) were determined by an iterative method according to the equation 2. The sum of the mass percentage of each chemical component in the sample was then calculated. The statistical results show that the total of the nine oxides determined in the raw meal with phosphogypsum was 99.78% (calculated on a burning basis). If the sum of the mass percentages of the chemical components in the sample was less than 99.78%, which indicates that the actual dilution ratio of the sample glass frit is greater than the standard dilution ratio, then we would have needed to set a dilution ratio greater than the standard dilution ratio and calculate the melt strength under the standard dilution ratio by equation 3, and then the sum of the concentration of the sample is calculated by using equation 2.
The above steps are supposed to be repeated until the total sample concentration is 99.78%. Conversely, the sum of the mass percentage is greater than 99.78%, which implies that the dilution ratio of the sample glass frit is less than the standard dilution ratio. Then, a dilution ratio that is smaller than the standard dilution ratio is set. The actual dilution ratio of the glass frit and the content of each chemical component in the sample could be obtained by the same method as above described. The commercial MLD calculation program automatically calculates the dilution ratio of the glass frit and the chemical content of the sample, according to the intensity result of the glass frit.
Accuracy of Sample Results with Different Dilution Ratios
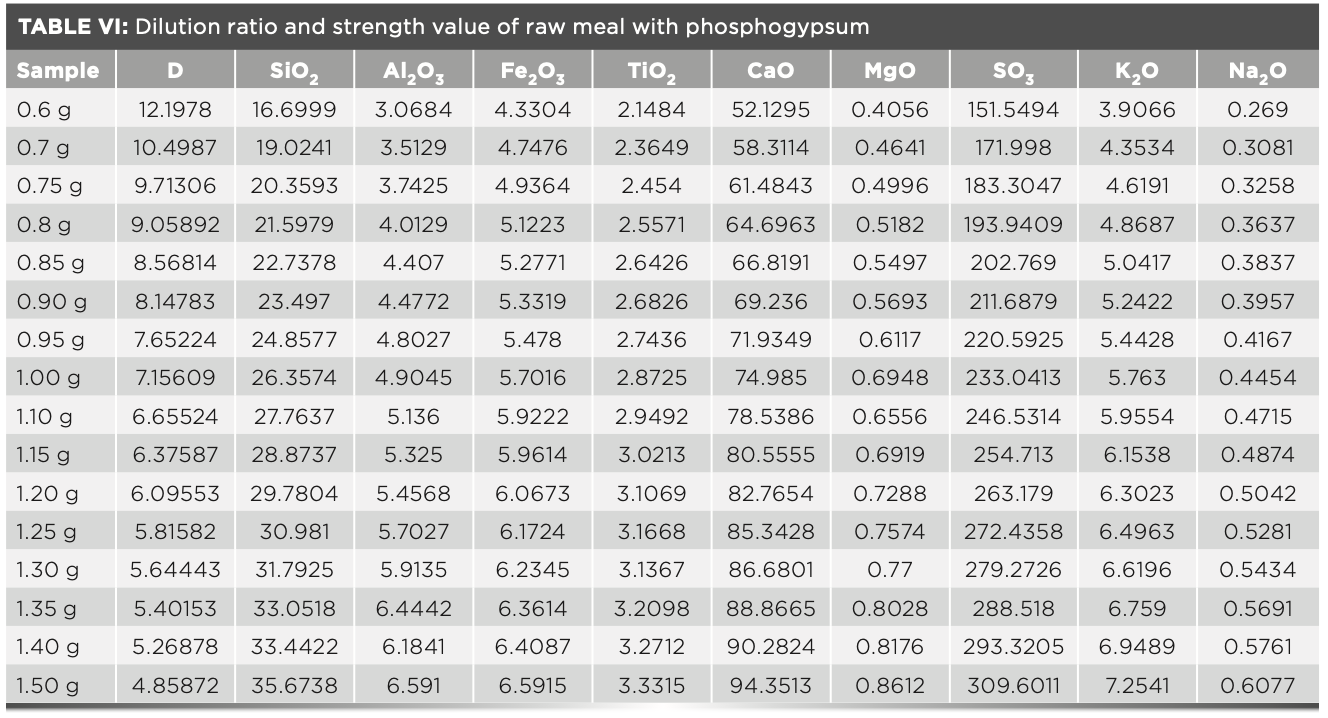
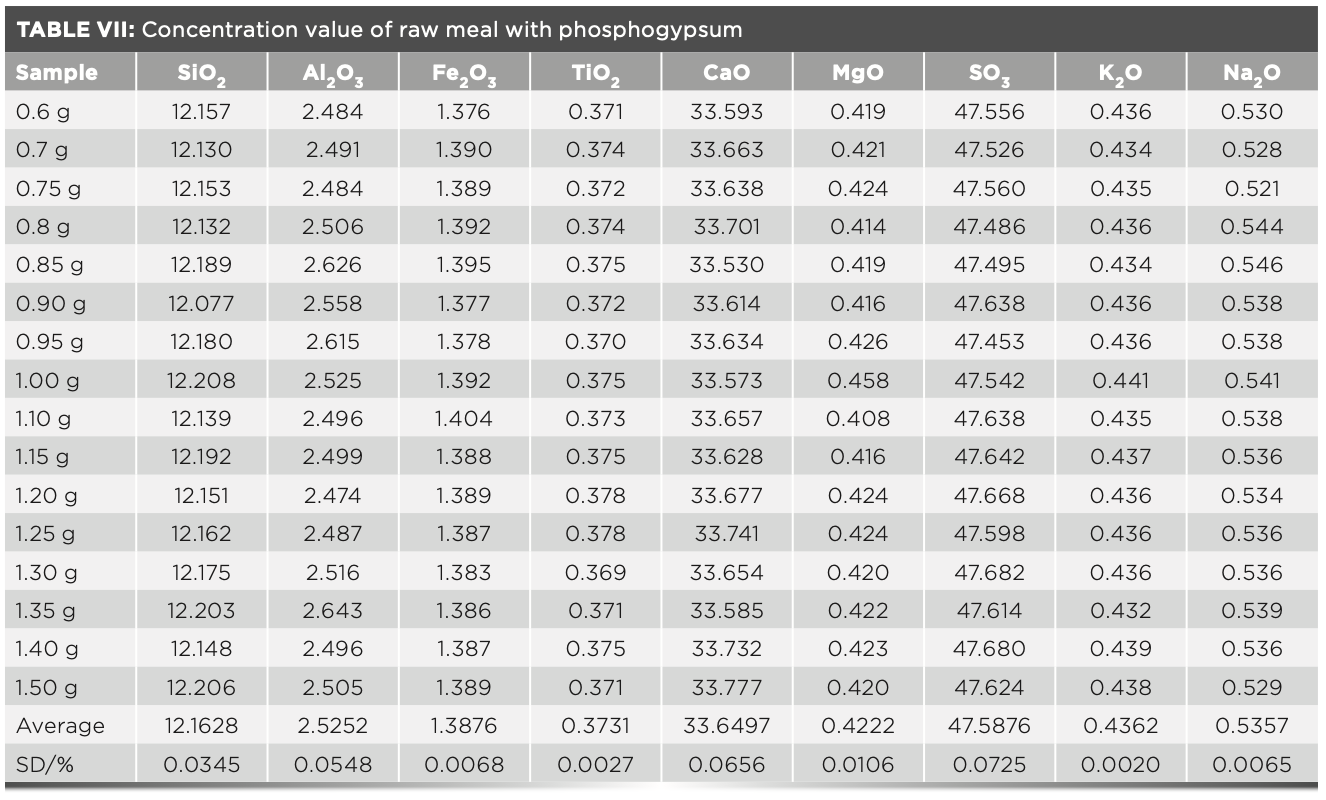
To start off, 16 fuses were prepared according to the fuse method described above. The melt dose was fixed at 6 g, and the mass of raw meal varies from 0.6–1.5 g. The intensity value was measured by the instrument and the calculated dilution ratio was shown in Table VI. The concentration values were calculated using the MLD calculation program and the statistical standard deviation of samples were shown in Table VII. In routine measurements, each sample was subjected to two parallel tests, and the standard deviation was calculated (n = 2). The results were compared with the statistical standard deviation. Table VI shows the standard intensity of samples with different dilution ratios that is corrected by equation 3, and Table VII shows the concentration values calculated by the MLD method. The deviation values of the obtained results are all less than 0.1, which shows that the precision of this method is excellent.


Loss of Sample Components During Calcination
Because of the particularity of the raw meal with phosphogypsum, the loss of the sample was reduced by adjusting the different preburning temperature without adding the oxidizing agent ammonium nitrate. The specific steps are as follows: 1.2 g of the raw meal and 6.0 g of the flux were placed in the crucible. Then, the crucibles were placed in a high temperature furnace with different temperatures and times. The temperature range was 500 °C to 800 °C, and the time range was 10 min to 20 min. The two parallel tests were performed, and the resulting data is shown in Table VIII. The temperature test of the sulfur content loss in the raw meal was carried out, and it showed that the sulfur content loss was the smallest when the temperature was 600 °C.

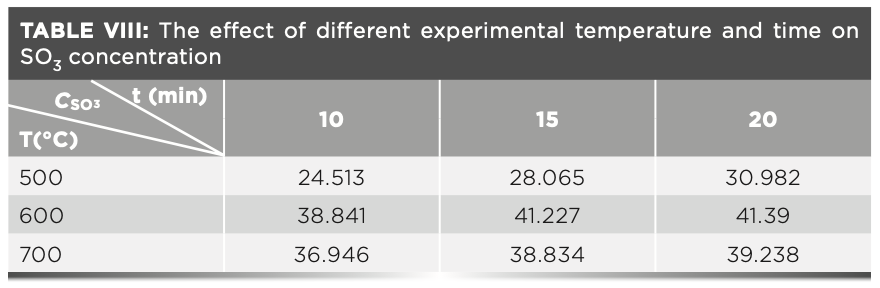

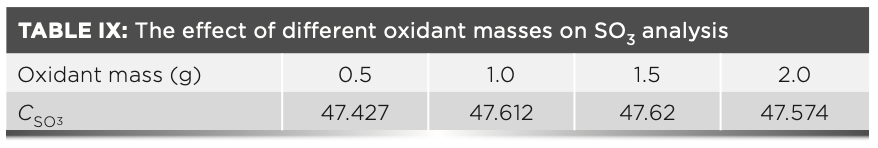
We can conclude from Table VIII that the carbon may not be completely removed by combustion at lower temperatures. Therefore, to further reduce the loss of sulfur, carbon was eliminated by adding different amounts of ammonium nitrate at a temperature of 600 °C. The influence of the amount of different oxidants on the experimental results is shown in Table IX. The results in Table IX show that about 1.0 g of ammonium nitrate can completely remove carbon from the sample as much as possible, and then the sample is melted at 950 °C, the sulfur element in the melt is stable and will not cause the loss of sulfur dioxide volatilization.


To summarize our findings, Table VIII and Table IX show that when calcination is performed without an oxidizing agent, the mass of sulfate sulfur in the raw meal is always low at a temperature that carbon can be removed. Thus, it is necessary to add 1.0 g of ammonium nitrate to the sample and calcine the sample at 600 °C before melting it.
Conclusion
The carbon in the mixture of raw meal with phosphogypsum and lithium borate salt is completely oxidized and removed at 600 °C under the coexistence of ammonium nitrate. When heated to 950 °C, the glass frit mixture of constant mass is formed, and sulfate in the mixture will not decompose.
In the range of dilution ratio of 5 to 12, the MLD coefficient was used to accurately convert the intensity of each element to the intensity at the standard dilution ratio. Accurate analysis results were obtained by preparing the samples with arbitrary dilution ratio, and the results showed that a XRF analysis of an MLD method could be applied to analyzing chemical components in raw meal with phosphogypsum.
References
(1) Q. Gao, Phosphate and Compound Fertilizer. 34(7), 41–44 (2019).
(2) H.W. Song, Cement Engineering 1, 13–16, 62 (1997).
(3) M.Y. Tan, L.X. Xiang, G.L. Li, et al. Guangzhou Chemical Industry, 44(8), 37–38 (2016).
(4) Z.Q. Yang, Q. Chen, Q.C. Guo, et al. Bull. Chi. Ceram. Soc. 35(9), 2860–2865 (2016).
(5) H.G. Ding, R.B. Ding, X.Z. Yang, et al. Comprehensive Utilization SP&BMH Related Engineering. 1, 1–6 (2011).
(6) Y.B. Liu, China Building Materials. 3, 106–107 (2017).
(7) F. Claisse and J.S. Blanchette, Physics and Chemistry of Borate Fusion. S. J. Zhuo, Ed. (East China University of Science and Technology Press, Shanghai, China, 2006), pp. 1–108.
(8) Y.B. Liu and J.J. Lu, Cement. 9, 56–59 (2016).
(9) China Patent CN103969273, 2013. https://patents.google.com/patent/ CN103969273B/en?oq=CN103969273.
(10) Y.B. Liu, J.J. Lu, and P. Dai, Cement. S1, 89–92 (2019).
(11) China Patent CN105486708, 2014. https://patents.google.com/patent/ CN105486708A/en?oq=CN105486708.
(12) J.J. Lu, Y.B. Liu, J.X. Ren, and W. Han, Key Engineering Materials. 680, 76–81 (2016).
(13) J.X. Ren, J.J. Lu, and P. Dai, Cement. 10, 55–58 (2014).
(14) P. Dai, Y. B. Liu, R. Yan, and Y. Z. Zhang, Key Engineering Materials 544, 437–440 (2013).
Dandan Gao is with the Key Laboratory of Interfacial Reaction and Sensing Analysis at the University of Shandong and the University of Jinan in Jinan, China, and with the China Building Materials Test & Certification Group Co., Ltd, in Beijing, China. Chuannan Luo is with the Key Laboratory of Interfacial Reaction and Sensing Analysis at the University of Shandong and the University of Jinan in Jinan, China. Yubing Liu, Ping Dai, and Juanjuan Lu, are with the China Building Materials Test & Certification Group Co., Ltd, in Beijing, China. Direct correspondence to: chm_yfl518@163.com. ●


Newsletter
Get essential updates on the latest spectroscopy technologies, regulatory standards, and best practices—subscribe today to Spectroscopy.


![Figure 3: Plots of lg[(F0-F)/F] vs. lg[Q] of ZNF191(243-368) by DNA.](https://cdn.sanity.io/images/0vv8moc6/spectroscopy/a1aa032a5c8b165ac1a84e997ece7c4311d5322d-620x432.png?fit=crop&auto=format)


