Publication
Article
Spectroscopy
Fluorescence Quenching Effects of Fe3+ Ions on Carbon Dots
Author(s):
In this study, we examined the frequently reported “selective fluorescence quenching effects” of Fe3+ ions on carbon dots. Instead of the believed “quenching effects” by Fe3+, the strong reduction of the fluorescence of carbon dots is likely because of the inner filter effect, which is caused by the strong ultraviolet (UV) absorption of Fe With the addition of Fe3+ ions, the UV absorption increases dramatically, compared to other metal ions. When Fe3+ ions coexist with carbon dots (CDs) in the solution, most of the excitation light is absorbed by Fe3+ ions, decreasing the excitation light obtained by CDs. This phenomenon leads to the “fluorescence quenching.” This finding helps us gain a better understanding of the fluorescence quenching effects of metal ions on carbon dots and understand the quenching effect of metal ions on other fluorescent materials.
Heavy metal ions are critically important to certain biological functions, but they are also considered environmentally hazardous and detrimental to human health if not handled and treated with the necessary precautions (1–7). As a result, methods of identification and quantification are necessary. Carbon dots (CDs) have attracted considerable attention as photocatalysts (8), sensors (9–10), printing inks (11), in drug delivery (12), and in bioimaging materials (13), because of their unique optical, electronic, and chemical properties. Because of the unique properties of CDs, metal ions demonstrate different fluorescence quenching effects on them. Particularly, Cu2+, Hg2+, Al3+, and Fe3+ ions have special fluorescence quenching effects on CDs, as summarized in Table I (14–24). However, there are still some important questions that need to be addressed. Why can Fe3+ ions selectively quench many types of carbon dots? And why is there no wide range of linear relationships between the quenching effects and the Fe3+ concentration, especially at relatively high concentrations (CFe3+ > 10 uM)?


As shown in Table I, regardless of the raw materials, the preparation methods of CDs or the ion quenching conditions used, Fe3+ ions have special selective fluorescence quenching effects on nearly all CDs. The selective fluorescence quenching of CDs by metal ions is because of the strong binding energy between the ions and the electron-rich nitrogen and oxygen groups on the surface of CDs (2,4–5,7,9–10). This theory can explain most cases; however, when it comes to Fe3+, there are some discrepancies.
For example, when it comes to electron capacity, which occurs in the order:
K+ <Ca2+ <Na+ <Mg2+ <Al3+ <Zn2+ < Fe2+ <Sn2+ <Pb2+ <(H+) <Cu2+ <Fe3+ <Hg2+ <Ag+ <Pt3+ <Au3+
Even though the electron capacity of Ag+ is stronger than that of others, the fluorescence quenching effect of Ag+ is much lower than that of Cu2+, Fe3+, and Hg2+ (17–18,23,25). This observation conflicts with the general assumption that electron capacity order determines quenching effect order. Furthermore, the ability of the Hg2+ ion to obtain electrons is stronger than that of the Fe3+ ion; however, in most cases, the fluorescence quenching effect of the Hg2+ ion is also much lower than that of the Fe3+ ion, which is also in conflict with the current general assumption.
In this study, we attempted to obtain a valid explanation for the selective fluorescence quenching effects on CDs.
Materials and Methods
Materials
All chemicals used were of analytical reagent grade, except garlic and grass samples. The compounds lithium chloride (LiCl), sodium chloride (NaCl), sodium hydroxide (NaOH), potassium chloride (KCl), silver nitrate (AgNO3), mercury (II) chloride (HgCl2), chromium (III) chloride (CrCl3), zinc chloride (ZnCl2), nickel chloride (NiCl2), iron (II) chloride (FeCl2), iron (III) chloride (FeCl3), calcium chloride (CaCl2), copper chloride (CuCl2), magnesium chloride (MgCl2), cobalt chloride (CoCl2), 6H2O, and aluminum chloride (AlCl3), were purchased from Sinopharm Chemical Reagent Co., Ltd. The stock solutions of metal salts were prepared using distilled water.
CD Synthesis
To confirm and further investigate the quenching mechanism in Table I, four kinds of CDs, namely CD-A, CD-B, CD-C, and CD-D, were made from different raw materials such as grass, glycine, glucose, citric acid, ethylenediamine, and garlic, according to previous studies (18–20,25).
Characterization
The ultraviolet-visible (UV-vis) absorption spectrum was obtained with a Cary 60 UV-vis spectrophotometer (Agilent Technologies). The photoluminescence (PL) spectra of CDs were obtained with a Cary Eclipse fluorescence spectrophotometer (Varian).
Quantum Yield (QY) Measurement
The QY of CDs was measured according to an established procedure (26). Quinine sulfate in 0.1 M of H2SO4 (the literature QY is 0.54 at 360 nm) was chosen as a standard. Absolute values were calculated using the standard reference sample that had a fixed and known fluorescence QY value. To minimize the absorption effects, the absorbance in the 10 mm fluorescence cuvette were kept under 0.1 at the excitation wavelength (360 nm). The QY was estimated to be 6.8%, 4.2%, 4.6%, and 7.3% for CD-A, CD-B, CD-C, and CD-D, respectively.
Ion Quenching Procedures
The experiment was performed at room temperature in distilled water. In a typical run, CD dispersion was diluted with distilled water to make sure the UV absorbance was lower than 0.1. The metal ions were also prepared in aqueous solution with distilled water. Subsequently, 10 mL of the as-prepared CD solution and 10 mL of the metal ion solution was mixed in a 25 mL glass bottle. The PL spectra were recorded after reaction for 5 min at room temperature.
Results and Discussion
Fluorescence Spectrum of CDs
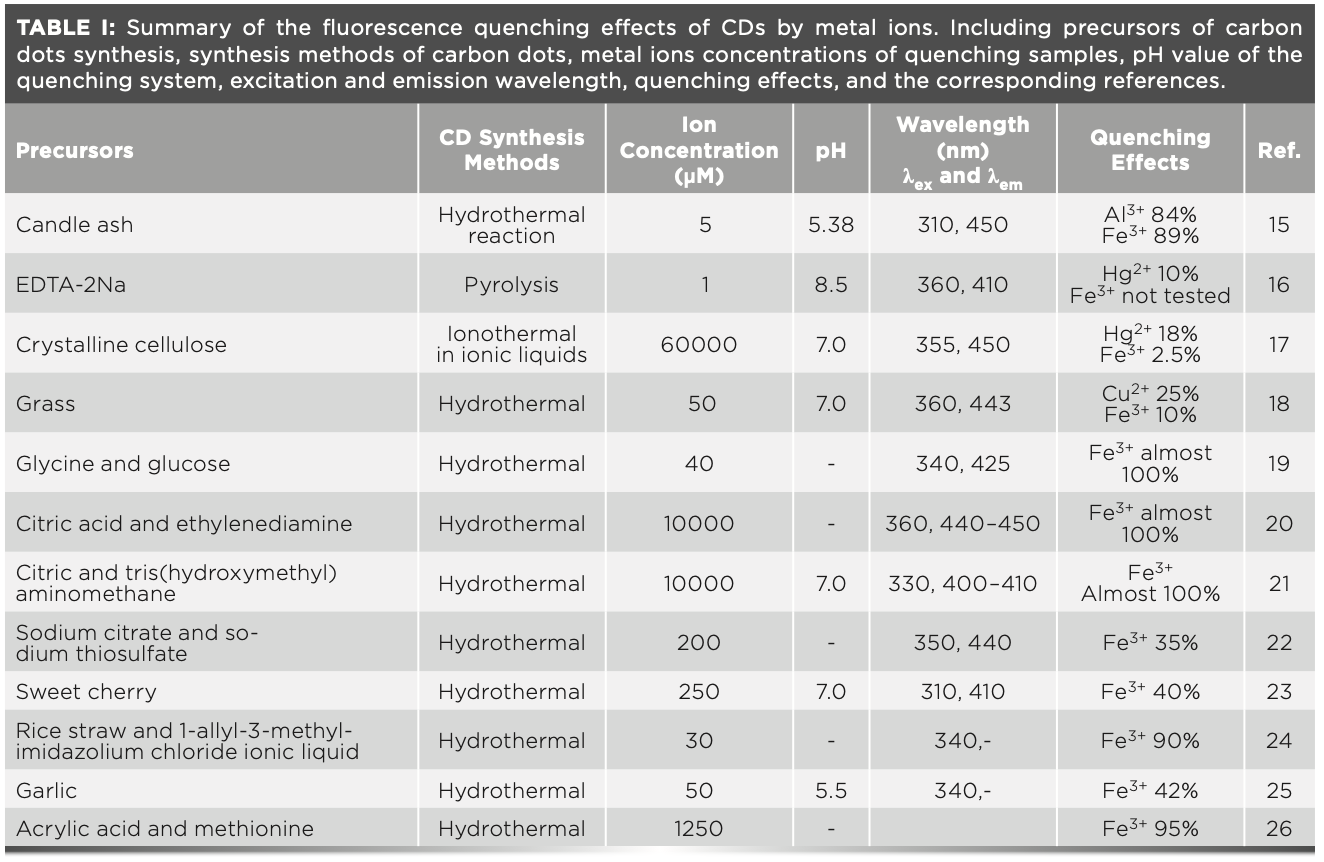
Figure 3 demonstrates that the CD-C material in aqueous solution has a single UV-vis absorption peak at 345 nm, and very bright blue luminescence under the illumination of UV (365 nm) light, even at a very low concentration (Absorbance <0.1). The CD-C aqueous solution can be seen in the inset of Figure 1. Excitation-dependent PL behavior was also observed as the literature (18), which is common in some fluorescent carbon materials (Figure 1) (27–30). When the excitation wavelength is changed from 300 nm to 400 nm, the emission wavelength demonstrated hardly any shift. This behavior contributes to the surface state affecting the bandgap of CDs (31). In the fluorescence spectra in Figure 1, CD-C has optimal excitation and emission wavelengths at 345 nm and 440 nm, which are different from the literature (19).

 and UV-vis absorbance spectra of CD-C; Inset: Photograph of CD-C under the illumination of UV (365 nm) light (left) and white light (right).")
FIGURE 1: Fluorescence emission spectra (slit ex = 2.5 nm, em = 5 nm) and UV-vis absorbance spectra of CD-C; Inset: Photograph of CD-C under the illumination of UV (365 nm) light (left) and white light (right).
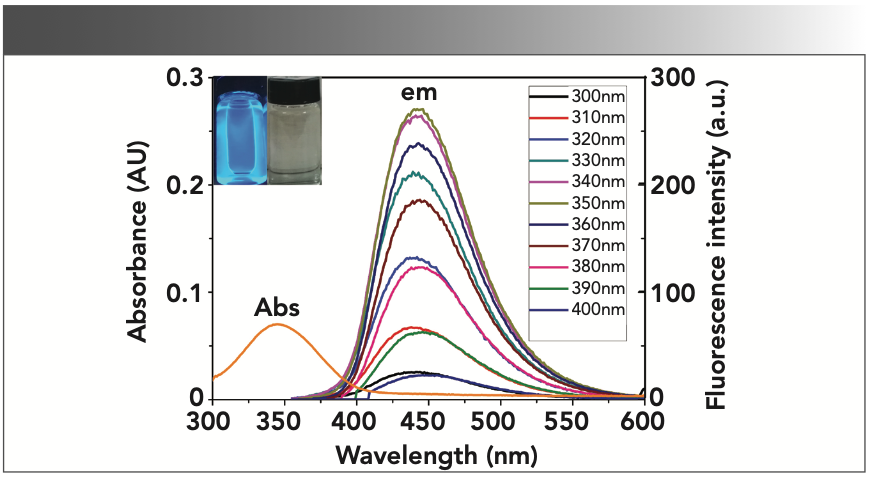

 UV absorbance of 1 mM metal ions. (b) UV absorbance of the quenching samples with 1 mM metal ions. (c) UV absorbance of quenching samples with different concentrations of Fe3+. (d) Relationship between Fe3+ concentration (0.005–1.000 mM) and the increased absorbance of the samples at 345 nm.")
FIGURE 3: UV-vis spectra of the metal ions and the quenching samples with CD-C. (a) UV absorbance of 1 mM metal ions. (b) UV absorbance of the quenching samples with 1 mM metal ions. (c) UV absorbance of quenching samples with different concentrations of Fe3+. (d) Relationship between Fe3+ concentration (0.005–1.000 mM) and the increased absorbance of the samples at 345 nm.
Metal Ions Quenching Effects on CDs
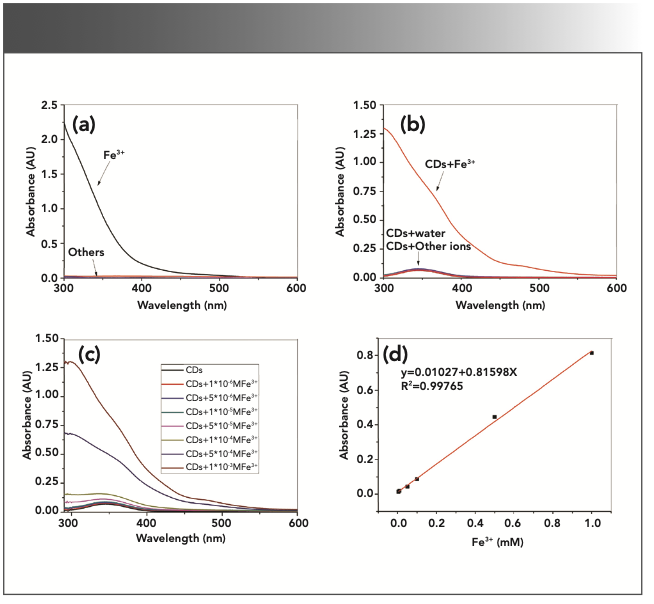
We investigated the fluorescence quenching effects of various metal ions on CDs in distilled water (Figure 2). A series of metal ions (Li+, Na+, Hg2+, Ni2+, Co2+, Mg2+, Ca2+, Cu2+, Zn2+, Al3+, Cr3+, Ag+, Fe2+, and Fe3+), each at a concentration of 1 mM were used in the experiment. As shown in Figure 2, the fluorescence quenching effects of the Fe3+ ions were much stronger than that of the other ions for all four of the synthesized CDs. According to previous work, there must be a unique mechanism that has yet to be accounted for.

 CD-A, (b) CD-B, (c) CD-C, and (d) CD-D, respectively (ex = 345 nm, em = 440 nm).")
FIGURE 2: Fluorescence quenching effects of 1 mM metal ions on CDs in distilled water corresponding to (a) CD-A, (b) CD-B, (c) CD-C, and (d) CD-D, respectively (ex = 345 nm, em = 440 nm).
Subsequent experimentations revealed that the selective quenching effects of Fe3+ on CDs were likely caused because of the inner filter effect, which occurred because of the strong UV absorbance of the Fe3+ ions (Figure 3a). When the CDs solution was mixed with Fe3+, the UV absorbance of the samples would dramatically increase compared to other metal ions (Figure 3b). To investigate the Fe3+ fluorescence quenching effects on CDs, CD-C was used in the quenching experiments because of its high QY.
UV Absorbance of the Samples
The UV absorbance of the metal ions (Li+, Na+, Hg2+, Ni2+, Co2+, Mg2+, Ca2+, Cu2+, Zn2+, Al3+, Cr3+, Ag+, Fe2+, and Fe3+, 1 mM) and their corresponding quenching samples are demonstrated in Figure 3. Figure 3a shows the UV absorbance of the metal ions aqueous solutions; apparently, only Fe3+ solutions have strong UV absorbance, whereas the other metal ions have hardly any absorption. As shown in Figure 3b, the addition of the Fe3+ ions would greatly enhance the UV absorption of the samples compared to the original CD solution. The absorbance of the samples intensified as the concentration of Fe3+ ions increased (Figure 3c). The increased absorbance is as high as 0.81 (1 mM Fe3+, 345 nm), and the excitation light could likely be absorbed by Fe3+ ions to some extent, decreasing the excitation light obtained by CDs and contributing to the quenching effects.
Finally, Figure 3d shows there is a highly correlated linear relationship between the Fe3+ concentration and the increased absorbance of the samples at 345 nm (which is the optimal excitation wavelength of CD-C). This indicates that it is possible to detect Fe3+ by UV absorbance when using CDs as sensors. In comparison, there is no good linear relationship between Fe3+ concentration and its absorbance (Figure 4b).

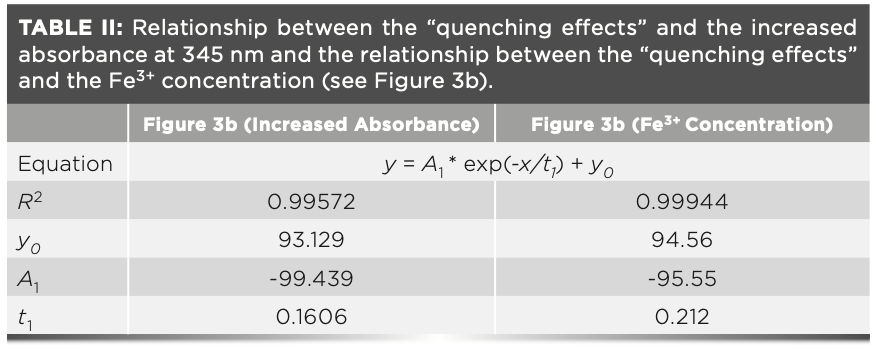
. (a) “FL quenching” spectra of CD-C with different concentrations of Fe3+. (b) Relationship between the “quenching effects” and the increased absorbance at 345 nm and the relationship between the “quenching effects” and the Fe3+ concentration. Quenching (%) = (F0 - F)/F0 × 100%.")
FIGURE 4: Fe3+ ions “quenching effects” on CD-C in distilled water. (ex = 345 nm, em = 440 nm, slit ex = 2.5 nm, em = 5 nm). (a) “FL quenching” spectra of CD-C with different concentrations of Fe3+. (b) Relationship between the “quenching effects” and the increased absorbance at 345 nm and the relationship between the “quenching effects” and the Fe3+ concentration. Quenching (%) = (F0 - F)/F0 × 100%.
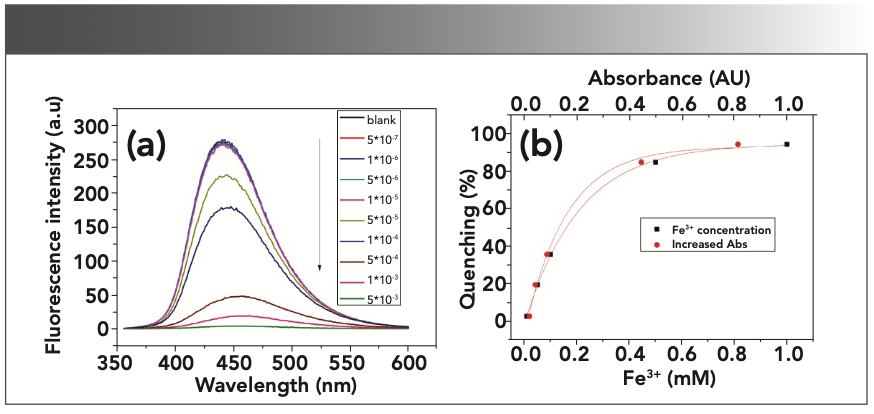
The Fe3+ ions in the samples absorb the excitation light and cause a decrease of the fluorescence intensity of the samples.
As shown in Figure 4a, only minor “quenching effects” were observed when the concentration of Fe3+ was lower than 10-5 M. This observation demonstrates that there is hardly any UV absorbance below concentration of 10-5 M (as shown in Figure 3c). We observe that the correlation between the “fluorescence quenching effects” and the increased absorbance (due to the Fe3+ concentration) is not linear. This phenomenon also has been found in other cases especially when the Fe3+ concentration is above 10-5 M (14,18). These nonlinear relationships indicate that the inner filter effect may be the main factor causing the “quenching effects,” but that it may not be the only factor. They can be functionalized via an exponential decay model with R-squared values of 0.99887 and 0.99944, respectively (Table II).


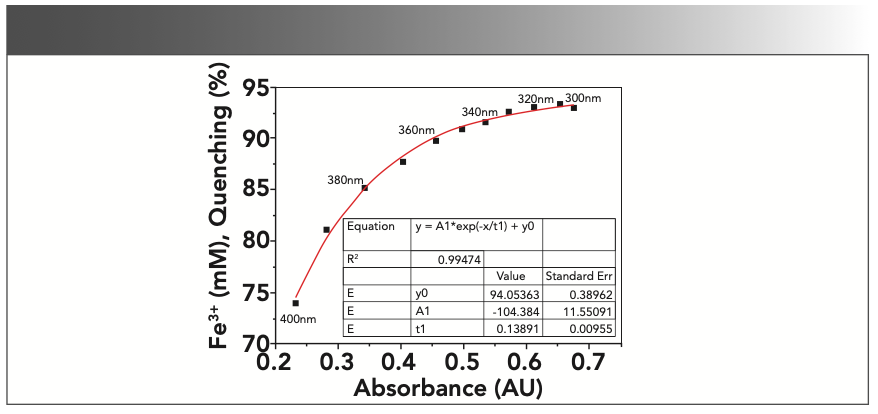
To further investigate the connections between the increased absorbance and the “quenching effects” on CDs, we conducted quenching experiments at different excitation wavelengths with CD-C. Under this circumstance, the absorbance of the samples would change along with the excitation wavelength, whereas the concentration of Fe3+ would remain unchanged. As shown in Figure 5, the “quenching effects” decreased as the absorbance became weaker. This correlation is similar to that demonstrated in Figure 4b, with the correlation between fluorescence “quenching effects” and the absorbance also fitting very well with an exponential decay model demonstrating an R2 of 0.99474.

.")
FIGURE 5: Correlations between fluorescence “quenching effects” and the increased UV absorbance of the samples at different excitation wavelengths. (0.5 mM Fe3+, distilled water, em = 440 nm, ex = 300–400 nm, 10 nm interval, slit ex = 2.5 nm, em = 5 nm).
CD solutions demonstrate on–off fluorescence phenomena with oxidation-reduction reactions with Fe2+ and Fe3+ ions (19,32), this could be because the absorbance of the samples with Fe2+ ions is much lower than that of Fe3+ ions (Figure 3b). Therefore, the selective “quenching effects” of Fe3+ on CDs are likely because of the strong UV absorbance of the Fe3+ ions (Figure 3a).
It is interesting that Fe3+ ions also have selective quenching effects on other fluorescent materials like metal-organic frameworks (MOFs) (33–37), rare earth materials (38), and organic chemosensors (39). The correlations between the quenching effects and the Fe3+ concentrations showed the similar pattern (nonlinear when the Fe3+ concentration was above 10-5 M). Based on the above observations, the selective quenching effects on these materials may also be because of the inner filter effect caused by the strong UV absorption of Fe3+ itself.
Conclusion
This report demonstrates the main reason why Fe3+ ions have selective quenching effects on CDs. The finding that the strong UV absorption of Fe3+ ions at specific concentrations plays a key role in the fluorescence quenching effects on carbon dots may help us to gain a better understanding of the quenching mechanisms and promote the application development of fluorescent metal ions sensors.
Acknowledgments
This work was supported by the China Scholarship Council (No.201808410585) for overseas research. We also appreciate the support from the School of Biological and Chemical Sciences, University of Missouri–Kansas City.
References
(1) S. Liu, J.Q. Tian, L. Wang, Y.W. Zhang, X.Y. Qin, Y.I. Luo, A.M. Asiri, A.O. Al-Youbi, and X.P. Sun, Adv. Mater. 24, 2037–2041 (2013).
(2) Z.X. Qin, W.H. Wang, X.Z. Zhan, X.J. Du, Q.M. Zhang, R. Zhang, K. Li, J.H. Li, and W.P. Xu, Spectrochim. Acta, Part A 208, 162–171 (2019).
(3) J.F. Shangguan, J. Huang, D.G. He, X.X. He, K. Wang, R.Z. Ye, X. Yang, T.P. Qing, and J. L. Tang, Anal. Chem. 89, 7477–7484 (2017).
(4) B.S. Chen, F.M. Li, L.L. Zou, D.J. Chen, J. Colloid Interface Sci. 534, 381–388 (2019).
(5) X. Zhu, J.Y. Wang, Y.H. Zhu, H.H. Jiang, D. Tan, Z.Q. Xu, T. Mei, J.H. Li, L.J. Xue, and X.B. Wang, Microchimica Acta 185, 510 (2018).
(6) K. Karali, L. Sygellou, and C. Stalikas, Talanta 189, 480–488 (2018).
(7) J.H. He, Y.Y. Cheng, T. Yang, H.Y. Zou, and C.Z. Huang, Anal. Chim. Acta 1035, 203–210 (2018).
(8) H.T. Li, X.D. He, Z.H. Kang, H. Huang, Y. Liu, J.L. Liu, S.Y. Lian, C.H.A. Tsang, X.B. Yang, and S.T. Lee, Angew. Chem. Int. Ed. 49, 4430–4434 (2010).
(9) X.H. Gao, Y.Z. Lu, R.Z. Zhang, S.J. He, J. Ju, M.M. Liu, L. Li, and W. Chen, J. Mater. Chem. C 3, 2032–2039 (2015).
(10) J. Plácido, S. Bustamante-López, K. E. Meissner, D. E. Kelly, and S. L. Kelly, Sci. Total Environ. 656, 531–539 (2019).
(11) R.Q. Bao, Z.Y. Chen, Z.W. Zhao, X. Sun, J.Y. Zhang, L.R. Hou, and C.Z. Yuan, Nanomaterials 8, 386 (2018).
(12) Q.L. Wang, X.X. Huang, Y.J. Long, X.L. Wang, H.J. Zhang, R. Zhu, L.P. Liang, P. Teng, and H.Z. Zheng, Carbon 59, 192–199 (2013).
(13) L. Cao, X. Wang, M.J. Meziani, F.S. Lu, H.F. Wang, P.G. Luo, Y. Lin, B.A. Harruff, L.M. Veca, D. Murray, S.Y. Xie, and Y.P. Sun, J. Am. Chem. Soc. 129, 11318–11319 (2007).
(14) L.Q. Liu, Y.F. Li, L. Zhan, Y. Liu, and C.Z. Huang, Sci. Chin. Chem 54, 1342–1347 (2011).
(15) L. Zhou, Y.H. Lin, Z.Z. Huang, J.S. Ren, and Q.X. Gang, Chem. Commun. 48, 1147–1149 (2012).
(16) C.Y. Wang, C.F. Wang, P.P. Xu, A.Q. Li, Y.J. Chen, and K.L. Zhuo, J. Mater. Sci 51, 861–867 (2016).
(17) S. Liu, J.Q. Tian, L. Wang, Y. Zhang, X. Qin, Y. Luo, A.M. Asiri, A.O. Al-Youbi, and S.X. Qing, Adv. Mater. 24, 2037–2041 (2012).
(18) T.T. Lai, E.H. Zheng, L.X. Chen, X.Y. Wang, L.C. Kong, C.P. You, Y.M. Ruan, and X.X. Weng, Nanoscale 5, 8015–8021 (2013).
(19) S.J. Zhu, Q.N. Meng, L. Wang, J.H. Zhang, Y.B. Song, H. Jin, K. Zhang, H.C. Sun, H. Y. Wang, and B. Yang, Angew. Chem. Int. Ed. 52, 3953–3957 (2013).
(20) M. Zhou, Z.L. Zhou, A.H. Gong, Y. Zhang, Q.J. Li, Talanta 143, 107–113 (2015).
(21) Q. Xu, P. Pu, J.G. Zhao, C.B. Dong, C. Gao, Y.S. Chen, J.R. Chen, Y. Liu, H.J. Zhou, J. Mater. Chem. A 3, 542–546 (2015).
(22) T.N.J.I. Edison, R. Atchudan, J.J. Shim, S. Kalimuthu, B.C. Ahn, and Y.R. Lee, J. Photochem. Photobiol. B 158, 235–242 (2016).
(23) R.L. Liu, M.P. Gao, J. Zhang, Z.L. Li, J.Y. Chen, P. Liu, D. Q. Wu, RSC. Adv 5, 24205–24209 (2015).
(24) Y.F. Chen, Y.Y. Wu, B. Weng, B. Wang, C.M. Li, Sens. Actuators B 223, 689–696 (2016).
(25) X. Cui, Y. Wang, J. Liu, Q. Yang, B. Zhang, Y. Gao, Y. Wang, and G. Lu, Sens. Actuators B. 242, 1272–1280 (2017).
(26) F. Wang, Z. Xie, H. Zhang, C.Y. Liu, and Y.G. Zhang, Adv. Funct. Mater. 21, 1027–1031 (2011).
(27) R.L. Liu, D.Q. Wu, S.H. Liu, K. Koynov, W. Knoll, and Q. Li, Angew. Chem. Int. Ed. 48, 4598–4601 (2009).
(28) M.J. Krysmann, A. Kelarakis, P. Dallas, and E.P. Giannelis, J. Am. Chem. Soc. 134, 747–750 (2012).
(29) H. P. Liu, T. Ye, C. D. Mao, Angew. Chem. Int. Ed. 119, 6593–6595 (2007).
(30) X.Y. Zhai, P. Zhang, C.J. Liu, T. Bai, W.C. Li, L.M. Dai, and W. G. Liu, Chem. Commun. 48, 7955–7957 (2012).
(31) D.Y. Pan, J.C. Zhang, Z. Li, C. Wu, X.M. Yan, and M.H. Wu, Chem. Commun. 46, 3681–3683 (2010).
(32) X. Miao, Y.X. Long, D. Qu, D.B. Li, F.F. Tao, Z.C. Sun, ACS. Appl. Mater. Inter. 9, 18549–18556 (2017).
(33) X.-H. Zhou, L. Li, H.-H. Li, A. Li, T. Yang, W. Huang, Dalton. T 42, 12403–12409 (2013).
(34) C. Zhang, Y. Yan, Q.H. Pan, L. Sun, H.M. He, Y.L. Liu, Z.Q. Liang, and J.Y. Li, Dalton. T 44, 13340–13346 (2015).
(35) Y.F. Li, D. Wang, Z. Liao, Y. Kang, W.H. Ding, X.J. Zheng, and L.P. Jin, J. Mater. Chem. C 4, 4211–4217 (2016).
(36) B. Wang, Q. Yang, C. Guo, Y.X. Sun, L.H. Xie, J.R. Li, ACS. Appl. Mate. Inter. 9, 10286–10295 (2017).
(37) Y.T. Yan, J. Liu, G.P. Yang, F. Zhang, Y.K. Fan, W.Y. Zhang, Y. Y. Wang, Cryst. Eng. Comm 20, 477–486 (2018).
(38) L.M. Zhang, B. Li, S.Z. Min, and S.M. Yue, Sens. Actuators B. 143, 595–599 (2010).
(39) X.D. Yang, X.L. Chen, X.D. Lu, C.G. Yan, Y.K. Xu, X.D. Hang, J.Q. Qu, and R.Y. Liu, J. Mater. Chem. C 4, 383–390 (2016).
Xiantao Feng is with the School of Chemistry and Pharmaceutical Engineering at Huanghuai University in Zhumadian, China, and the Department of Chemistry, at the University of Missouri–Kansas City, in Kansas City, Missouri. Yanmei Xie and Wenqian Zhao are with the School of Chemistry and Pharmaceutical Engineering at Huanghuai University in Zhumadian, China. Michael Green and Xiaobo Chen are with the Department of Chemistry, at the University of Missouri–Kansas City, in Kansas City, Missouri. Liang Liu is with Green Intelligence Environmental School at Yangtze Normal University in Chongqing, China. Direct correspondence to: xtfeng@mail.ipc.ac.cn and chenxiaobo@umkc.edu. ●


Newsletter
Get essential updates on the latest spectroscopy technologies, regulatory standards, and best practices—subscribe today to Spectroscopy.


![Figure 3: Plots of lg[(F0-F)/F] vs. lg[Q] of ZNF191(243-368) by DNA.](https://cdn.sanity.io/images/0vv8moc6/spectroscopy/a1aa032a5c8b165ac1a84e997ece7c4311d5322d-620x432.png?fit=crop&auto=format)


