
|Articles|January 1, 2015
- Spectroscopy-01-01-2015
- Volume 30
- Issue 1
Down to Earth: Measurements of Geological, Coal, and Soil Samples with LIBS
Author(s)Steven G. Buckley
This article explores the use of laser-induced breakdown spectroscopy (LIBS) for measurements of elemental concentrations and bulk properties of heterogeneous, earthen-based samples. Rapid field and industrial measurements of these matrices are difficult using traditional methods.
Advertisement
This article explores the use of laser-induced breakdown spectroscopy (LIBS) for measurements of elemental concentrations and bulk properties of heterogeneous, earthen-based samples. Rapid field and industrial measurements of these matrices are difficult using traditional methods. Here, we discuss the progress and promise of LIBS in making these measurements. Sample preparation, calibration, and typical results are shown. Of particular interest is the ability to extract physical properties from LIBS measurements. Examples such as heating value and volatile matter of coal, directly derived from LIBS spectra, show the ability and potential of the method to be used in fielded industrial measurements for rapid decision-making.
A variety of basic industrial and energy-related procedures involve processing large quantities of geologically derived material. Examples include exploration and production geology in the oil and gas industry, mining of phosphates for the fertilizer industry, coal mining, and cement production. Similar needs exist in agriculture for the evaluation of soil macronutrients such as potassium and phosphorus before the application of fertilizers. In these cases, composition analysis can directly yield concentrations of interest (for example, phosphate in mined rock or potassium in soil), a suite of elements can provide information used to guide operations (such as characterization of geology during drilling), and models based on composition measurements can directly yield properties of geologically derived material (for example, total ash content or heating value of coal).
Each of these high-throughput processing environments would benefit from more immediate data that could be linked directly to guide processing. Real-time data with closed-loop feedback is the ultimate goal in each case. Benefits, projected or already realized, include increasing mining recovery, improving oil and gas exploration and recovery, precision blending of mined components to optimize product streams, data-driven application of fertilizer to reduce waste and enhance agricultural productivity, and efficient operation of coal power plants. In each of these cases, the analysis step is typically a bottleneck. Traditional laboratory-based analysis yields high precision and accuracy, but with a significant time penalty. One of the opportunities for laser-induced breakdown spectroscopy (LIBS) technology is to exploit the ability for remote or stand-off real-time analysis to improve the speed of the analysis process, moving these operations closer to closed-loop control.
LIBS Capabilities
Several recent tutorial articles in this magazine (1–3) as well as a number of monographs (4,5) and a burgeoning amount of applications-based literature provide background on the capabilities of LIBS analysis and suggestions for hardware configurations. The stand-off projection of the laser onto the sample and the rapid analysis capabilities are key attributes of LIBS for earthen-based samples, as well as the ability to measure light elements. In addition, full-spectrum analysis can be used for direct correlation of spectra to properties, avoiding the need to measure every element and subsequently model properties.
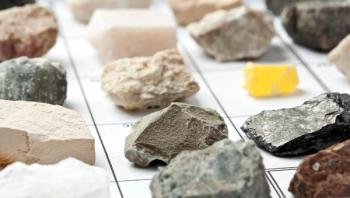
There are numerous commonalities between soil, coal, and geological sample analyses. Each sample type is a heterogeneous material requiring bulk analysis. There are multiple important major elements (such as N, P, and K in soil and C and H in coal), and the range of important trace elements is between approximately 10–500 ppm. These measurement requirements are within LIBS detection limits, and the precision needs are also within the reach of LIBS technology, between 1–3% relative error over the bulk of the analysis range. Each of the measurements also can benefit from the ability to analyze light elements such as C, H, and N.
Sample Handling
There are two options for obtaining a representative set of LIBS spectra from heterogeneous materials for analysis. The first is to acquire and average many shots on the heterogeneous sample, forming a composite spectrum (or set of spectra) that can subsequently be used for quantification. In a truly heterogeneous sample with a heterogeneity scale on the order of the analysis spot size, each laser shot hits a distinct type of inclusion in the bulk. This condition is close to true for earthen-derived samples. Hence, some laser shots could, for example, hit mineral inclusions of SiO2, others could hit CaCO3, and still others could hit organic matter, and so on. The question is: Can a set of heterogeneous spectra be used to easily quantify elements, classify types of materials, or determine properties?
This diversity of spectra thus obtained presents a pair of related challenges for LIBS. One challenge is that the absolute signal for the specific component being measured in this "unmixed" manner is much greater than it would be if the sample were homogenous. For example, if 5% of a sample were MgO, and this were the primary form of Mg in the sample, we would expect that an unmixed sample would experience roughly 20 times the Mg signal when an inclusion of MgO were hit than if the MgO were crushed and thoroughly mixed throughout the sample. Such wide signal variation would put a requirement for dynamic range on the detector that would be difficult or impossible to meet in practice. A second challenge is that calibration becomes much harder in the unmixed state. Because LIBS calibrations are matrix-dependent, using a single calibration depends on having a homogenous, known matrix. A calibration cannot be easily performed on the "average" spectrum because the intensities of each line are not only dependent on the underlying elemental concentration, but also on the overall composition of the material. Therefore, in this case, it is likely that independent calibrations of the types of minerals in the "unmixed" materials would be required to obtain accurate calibrations. Alternatively, calibrations could be built based on composite spectra, but such calibrations would be quite sensitive to the specific mineralogy of each element in the sample, as that mineralogy would form the "matrix" for each element. In contrast, in a truly homogenous sample, the large part of the matrix remains the same in each spectrum.
Figure 1: Typical sample press. There is a die between the platens and extra dies to the right of the press.
Homogenizing the sample is thus the easier approach, from a calibration and analysis standpoint. This can be done using a variety of methods. In the laboratory, samples are commonly ground and pressed in a pellet press with a known force for a particular period of time. Figure 1 shows a common sample press used in our laboratory. Sample is placed in the dies (examples shown on the right) and then pressed to up to 20 tons between the platens in the press. From experience, it is important to press the samples to uniform pressure and time to ensure that the LIBS ablation event remains the same for each analysis. Varying time and pressure in the preparation results in samples that ablate differently, and hence have unwanted spectral variations. Figure 2 illustrates a pellet pressed from a soil sample. The pellet is hard (does not crumble) and has a slightly smaller diameter than a United States penny.
Figure 2: Pressed soil pellet ready for analysis.
Analysis
All of the samples were tested in one of the ChemReveal integrated LIBS spectrometers in our laboratory at TSI. This is a Class-1 (eye-safe) integrated laboratory system with a basic layout shown in Figure 3. Samples inserted into the system are visualized on a video camera and spectra from single spots, lines, or grids of analysis spots can be obtained. No inert gas purge was used on any of the samples, although this is an option that can, in some cases, improve signal-to-noise ratios.
Figure 3: Schematic layout of the integrated LIBS analyzer.
Soil, coal, and geological samples from drilling operations were all analyzed under different experimental conditions as part of ongoing studies. Examples are presented here to illustrate the range of possibilities. For example, our partner company dickey-JOHN has a soil database of 500 well-characterized soils. From this, we obtained 15 samples with a range of characteristics to see how well we could correlate potassium concentrations. We pressed the samples as shown in Figure 2, and took a small number of LIBS spectra (160 individual spectra) by making 10 shots on a 4×4 grid on each sample. We focused 70-mJ pulse energy into 300-μm spots. Spectra were averaged in groups of four, resulting in 40 spectra per individual sample. Data were fed into a support vector machines algorithm, with 95% of the overall data used for training the calibration model, and 5% of the data reserved for testing.
Figure 4: Prediction of potassium in soil from a very limited dataset. For the predicted value: explained variance = 89%, mean error = 34.
Figure 4 shows the results of this very preliminary study with a limited number of data points. Predicted potassium concentration (in inconvenient units of "lb/acre") is shown on the x-axis and ICP measurements of the actual value are shown on the y-axis. The blue line is the model calibration and the green points are the prediction of the model using the independent test data. The model explains 89% of the variance in the data and the mean error is 34 units. In practice, far more data would be used to build such a model, but this initial validation has provided an impetus for further work in our laboratory.
Figure 5: Volatile matter in coal (percent), predicted by LIBS versus actual.
An example in which much more data was used (with much better results, as shown) is in some recent coal measurements we accomplished with Tsinghua University. This study, with the group of Professor Zhe Wang, is part of a larger collaboration aimed at developing LIBS-based coal analyzers. Here, we have a database of more than 75 well-characterized coals that are commonly used in China, from which we have taken hundreds of spectra over time. We have used the data to build a predictive model for both elemental concentrations and numerous coal properties of interest in power plant operations. Examples of LIBS-based property predictions are shown in Figures 5 and 6. Actual measurements used for reference were Chinese standard methods performed in multiple laboratories. Figure 5 shows accurate prediction of volatile matter (in percent), while Figure 6 illustrates direct prediction of coal heating value (in MJ/kg) using LIBS. Recent on-site tests of the system at the Zhangqiu power plant owned by China Huadian Corporation has shown overall validation error of less than 1% for the system for several of the parameters of interest.
Figure 6: Heating value of coal (MJ/kg, dry), predicted by LIBS versus actual.
Similar to the coal work, a LIBS analysis of core samples from a drilling operation (energy exploration) was performed to determine elemental concentrations. As previously done, samples were ground and pressed into pellets. A partial least squares-based model was used to quantify concentrations from the LIBS spectra, using X-ray fluorescence (XRF) measurements as the standard method. Example relative standard deviations for multiple elements shows the repeatability of the LIBS measurement to be between 2% and 6%. Figure 7 shows the results for Mg, which are representative of most of the elements tested. It is expected that the uncertainty in the XRF measurement is comparable if not greater than the uncertainty in the Mg measurement.
Figure 7: Magnesium concentration measured with LIBS versus XRF.
Implications
These measurements clearly indicate the potential for LIBS in measurements of earthen-based samples. Homogenizing the samples before measurement allows accurate and repeatable measurements, even in tough conditions, as shown in on-site measurements. Interestingly, LIBS can be used to measure elemental concentration, sample type, or sample properties directly. The exploratory work shown here has led to additional efforts in sampling and method automation that are quite exciting. The real-time analysis and light element capability of LIBS makes it clearly attractive for rapid laboratory and field measurements of geological materials of many kinds.
Acknowledgments
The author thanks Dr. Markus Gaelli (TSI) for generously taking the data on soil samples at short notice, and acknowledges Dr. Gregg Lithgow and Kregg Philpott (also both with TSI) for helping to acquire the data from the geological samples.
References
(1) S. Buckley, Spectroscopy29(1), 22–29 (2014).
(2) S. Buckley, Spectroscopy29(4), 26–31 (2014).
(3) S. Buckley, Spectroscopy29(10), 24–33 (2014).
(4) D.A. Cremers and L.J. Radziemski, Handbook of Laser-Induced Breakdown Spectroscopy (Wiley, Hoboken, New Jersey, 2013).
(5) R. Noll, Laser-Induced Breakdown Spectroscopy: Fundamentals and Applications (Springer, Heidelberg, Germany 2012).
Dr. Steve Buckley is Director of Market Development at TSI Incorporated, which acquired the LIBS business of Photon Machines, Inc. in 2012. Prior to cofounding Photon Machines, Steve was a tenured professor of engineering at the University of California, San Diego. He has been working on research and practical issues surrounding the implementation of LIBS since 1998. Steve can be reached at
Dr. Steve Buckley
Articles in this issue
over 11 years ago
IR Spectral Interpretation Workshopover 11 years ago
Next-Generation Infrared Spectroscopic Imagingover 11 years ago
Quantifying Proteins by Mass Spectrometryover 11 years ago
A Matter of Interpretationover 11 years ago
App of the Month: SpectrumLITEover 11 years ago
Vol 30 No 1 Spectroscopy January 2015 Regular Issue PDFAdvertisement
Related Content
Advertisement


Advertisement
Advertisement
Trending on Spectroscopy Online
1
The State of Spectroscopy Careers
2
From Single-Technique Analysis to Multimodal Characterization: Recent Advances and Future Perspectives for Carbon Nanotubes and Graphene
3
Exploring Mars' Lost-Water Narrative Using Raman Spectroscopy and X-ray Fluorescence
4
Environmental Sample Prep Workflow Optimization
5