Measurement of Ammonia Leakage by TDLAS in Mid-Infrared Combined with an EMD-SG Filter Method
In this article, tunable diode laser absorption spectroscopy (TDLAS) is used to measure ammonia leakage, where a new denoising method combining empirical mode decomposition with the Savitzky-Golay smoothing algorithm (EMD-SG) is proposed to improve the signal-to-noise ratio (SNR) of absorbance signals.
Ammonia (NH3) has been used as the main refrigerant in various types of cold storages, exceeding 90% of cooling applications. However, NH3 leakage occurs frequently due to damage of the refrigeration compressor, resulting in environmental pollution and intoxication accidents. Therefore, reliable and highly sensitive NH3 detection is a critical requirement in cold storage. In this paper, tunable diode laser absorption spectroscopy (TDLAS) is used to measure NH3 leakage, where a new denoising method combining empirical mode decomposition with the Savitzky-Golay smoothing algorithm (EMD-SG) is proposed to improve the signal-to-noise ratio (SNR) of absorbance signals. The results show that a 5.5 times improvement of SNR and 86% reduction of the linear fitting error in calibration is obtained; furthermore, this system achieves a detection limit of 0.2 ppm at an average time of 69 s by Allan variance analysis. Hence, it can be concluded that the EMD-SG algorithm can effectively improve the performance of TDLAS systems to meet the requirements for NH3 leakage detection in cold storages.
Ammonia (NH3) is extensively utilized as a refrigerant in commercial refrigeration (1) due to its lower environmental impact, cost-effectiveness, and superior refrigeration efficiency compared to alternatives, such as chlorofluorocarbons. However, NH3 leakage happens frequently because of damage to the refrigeration compressor under long-term operation. Evidence shows that excessive NH3 leakage can lead to human poisoning or death, combustion explosions, and water or soil pollution (2). For example, in 2013, an NH3 leakage at Bao yuan feng Poultry in China’s Jilin Province resulted in 121 fatalities and 76 injuries. Correspondingly, a primary warning value of 25 ppm for NH3 concentration in cold storages has been recommended by the International Institute of Ammonia Refrigeration (IIAR). Therefore, reliable and extremely sensitive NH3 detection is crucial in refrigeration applications.
Traditional NH3 measurement methods mainly include chemical detection, chemical sensor detection, and gas chromatography. Despite their cost-effectiveness and simplicity, these methods fail to achieve long-term online detection and high accuracy. To address these challenges, various spectral detection methods have been developed, including differential optical absorption spectroscopy (DOAS), Fourier transform infrared (FT-IR) spectroscopy, and photoacoustic spectroscopy (PAS). However, the complexity, instability, and susceptibility to environmental interference associated with these methods partially restrict the widespread application of these technologies.
Compared to the above detection methods, tunable diode laser absorption spectroscopy (TDLAS) has been widely used in real-time online detection for its high resolution, high sensitivity, rapid response, and anti-interference properties (3–5). Zhang Zengfu and others obtained NH3 minimum detection limits (MDL) of 1.21 ppm and 1.61 ppm in 2013 using an optical path of 18 m and 17 m, respectively (6), where multiple reflection cells are utilized to provide this optical path. In 2019, Guo Xinqian and others designed a variable temperature multi-pass cell with a 15 m optical path to detect the second harmonic signal, resulting in a 435 ppb method detection limit (MDL) for NH3 based on a 1515.17 nm distributed feedback (DFB) laser (7). However, an additional temperature controller increases the system complexity. In 2021, Lu Hongbin et al. achieved ppb-level NH3 detection sensitivity with a 1512.25 nm DFB laser and an open optical path (8). Obviously, much previous attention was paid to the second harmonic signal, extended optical paths, and the NH3 absorption in the near-infrared (NIR) band. Whereas, the absorption spectrum of NH3 located in NIR bands typically consists of overtones of the fundamental vibrations from mid-infrared (MIR) bands, and hence can be significantly weaker. Meanwhile, alongside the progress of performance, the quantum cascade laser (QCL) has been widely applied in optical gas measurement due to its high power and narrow linewidth as compared to DFB lasers. Therefore, the detection characteristics of ammonia in mid-infrared bands are worthy of further exploration. Additionally, the signals obtained by TDLAS systems may contain nonlinear and non-stationary noise introduced by optical and electronic components (9), which may cause the reduction of signal-to-noise ratios (SNRs) and even overwhelm the analyte signal at low concentrations. Thus, further noise reduction is necessary for the detected signal.
In this paper, a TDLAS system, combined with direct absorption detection in mid-infrared bands and a 20 cm straight-through optical cell, is designed to measure NH3 leakage. Then, a new denoising method combining empirical mode decomposition with a Savitzky-Golay smooth algorithm (EMD-SG) is proposed to improve the SNR of absorbance signals. Finally, we analyze the stability and detection limit of the system via experiments and Allan variance.
Material and Methods
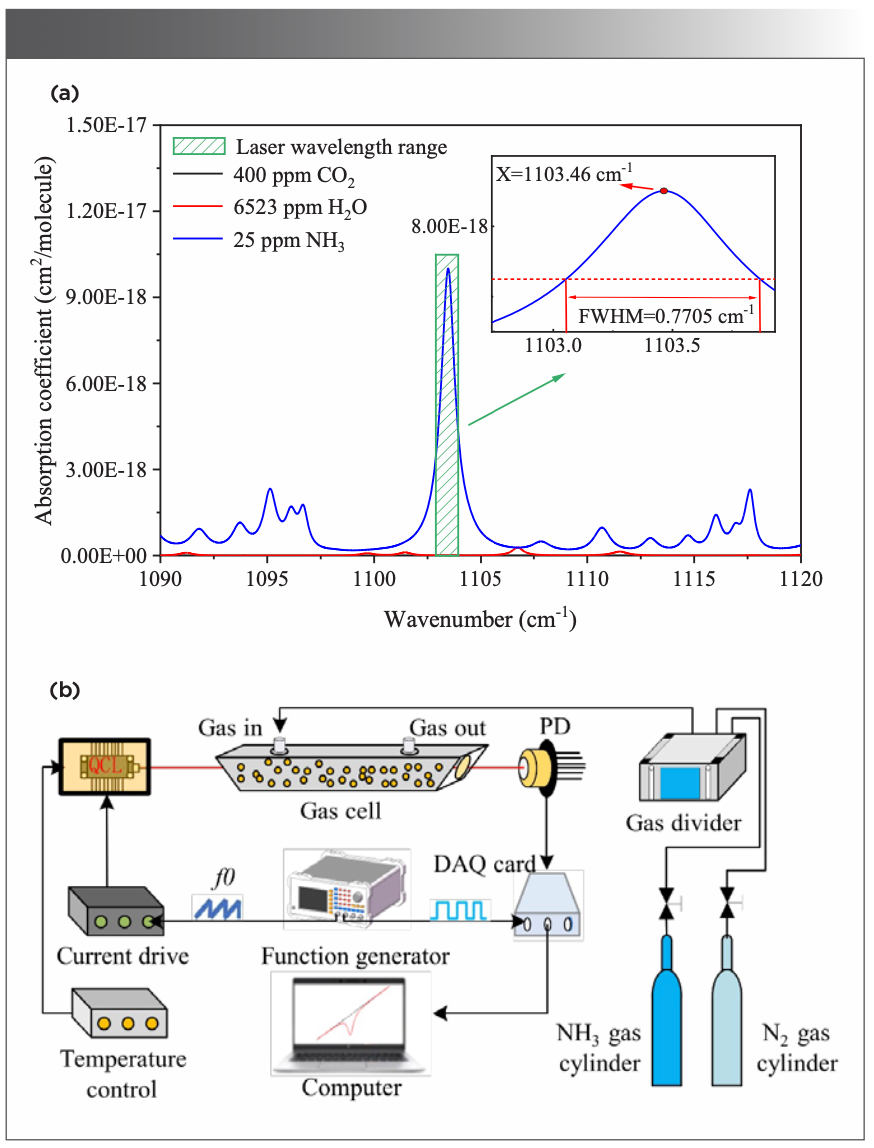
To improve detection performance, the target line for NH3 leakage detection should have not only as strong intensity as possible, but also minimal interference from coexisting gases (predominantly H2O and CO2 in cold storages). Based on the high-resolution transmission molecular absorption database (HITRAN), we simulate the spectral overview of 25 ppm NH3 as recommended by IIAR, alongside the coexistence of 400 ppm CO2 in the atmosphere and 6523 ppm H2O, corresponding to 75% relative humidity at 278 K and 1 atm. As depicted in Figure 1a, an independent and strong NH3 absorption line exists near 1103.46 cm-1, where the CO2 and H2O have no obvious absorption. Additionally, as shown in the Figure 1a inset, the linewidth of absorption line at 1103.46 cm-1 is 0.77 cm-1, which is beneficial to enhance detect precision. Therefore, the line at 1103.46 cm-1 is chosen to measure NH3 leakage.

 NH3, H2O, and CO2 absorption spectra from 1090 cm−1 to 1120 cm−1 based on a HITRAN database; and (b) Structure of NH3 detection system based on TDLAS.")
FIGURE 1: Experimental setup: (a) NH3, H2O, and CO2 absorption spectra from 1090 cm−1 to 1120 cm−1 based on a HITRAN database; and (b) Structure of NH3 detection system based on TDLAS.
Then, we construct a TDLAS system to realize NH3 detection. As shown in Figure 1b, a 2 Hz ramp signal generated by an arbitrary waveform generator (Fluke 284, Fluke) is injected into laser current controller (LDX-3232, ILX Lightwave) to sweep laser wavelength. In addition, a 9050 nm QCL (ATO9050, AdTech Optics) is utilized as an excitation light source. Meanwhile, a temperature controller (TC-3, Alpes Lasers) is applied to avoid laser wavelength drift caused by temperature changes. In experiments, the laser beam passes through the self-made gas cell and exists a certain attenuation in light intensity. Afterwards, the attenuated light is converted into an electrical signal by the photoelectric detector (PVMI-2TE-10.6, VIGO), which is highly integrated with the filter amplifier circuit. Finally, the electrical signal is recorded by the data acquisition card (PCI-6251, National Instruments) and uploaded to the computer.
Theory
Theory of TDLAS
When a beam of monochromatic laser with light intensity I0 propagates in a gas medium, the intensity of the laser generates attenuation due to the gas absorption, which can be specifically expressed by the Beer-Lambert law as (10):


where L is the length of effective optical path, g(v) is the normalized line profile function, S(T) is the spectral line intensity, I1(v) is the transmitted light intensity, I0(v) is the incident light intensity, C is the concentration of the gas to be measured, P is the pressure of the gas, and N represents the total molecular number density of the gas.
At atmospheric pressure, the normalized line profile function can be described by the Lorentz line shape as:


where v0 is the central wavenumber of the spectral line, and ∆vc represents the full width at half maximum (fwhm) of the spectral line. Then equation 1 can be simplified at v0 as:


Here, -ln(((I1(v0))⁄(I0(v0))) is denoted as Apeak, which represents the peak absorbance. Apparently, it is proportional to the C while other parameters remain constant. Therefore, the peak absorbance can be utilized to calculate the gas concentration.
EMD-SG Denoising Theory
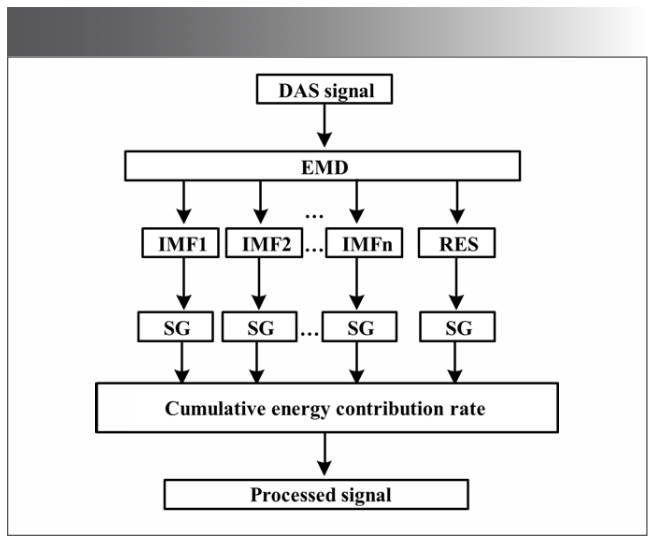
The common noise reduction methods mainly include signal averaging (11), wavelet transform (12), Kalman filtering (13), and Savitzky-Golay (SG) filtering (14). These methods are restricted to the signal with the characteristics of either nonlinear stationary or linear non-stationary. When the signal is both nonlinear and non-stationary, such as direct absorption signals in TDLAS, the empirical mode decomposition (EMD) algorithm exhibits better applicability (15,16).
The EMD algorithm involves adaptive decomposition of the direct absorption spectroscopy (DAS) signal into a sequence of intrinsic mode functions (IMFs) and a residual (RES), expressed as:


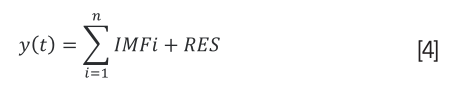
Where y(t) is the original signal, and the IMFs obtained by EMD must satisfy two preconditions (17). On the one hand, the number of zero-crossing points and extreme points should be either equal or differ by at most 1 in the entire signal. On the other hand, the upper and lower envelopes obtained from the local extremum points should be symmetrical about the time axis at any moment.
Typically, the noise reduction is realized by removing the high-frequency components, then reconstructing the signal with remained IMFs and a residual. Although this method is accessible and convenient, the useful information in the removed components is ignored so as to introduce new error factors into reconstruction. To overcome the weakness, a Savitzky-Golay (SG) filter is applied to further process the IMFs.
Since being first proposed, the SG filtering method has been extensively utilized in noise reduction. The fundamental procedure involves utilizing polynomials to fit the data within a given window length (18), as given by:

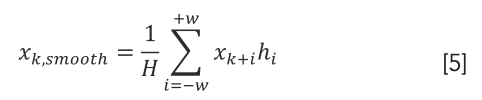

Here, xk,smooth is the filtered value with a window length of H. hi⁄H is the filter smoothing coefficient, obtained by polynomials fitting with the least square method.
Finally, the denoised IMFs are selected according to the cumulative energy contribution rate and then reconstructed into the final signal. The specific flow chart of the EMD-SG algorithm is shown in Figure 2.


FIGURE 2: EMD-SG denoising algorithm flow chart.
Results and Analysis
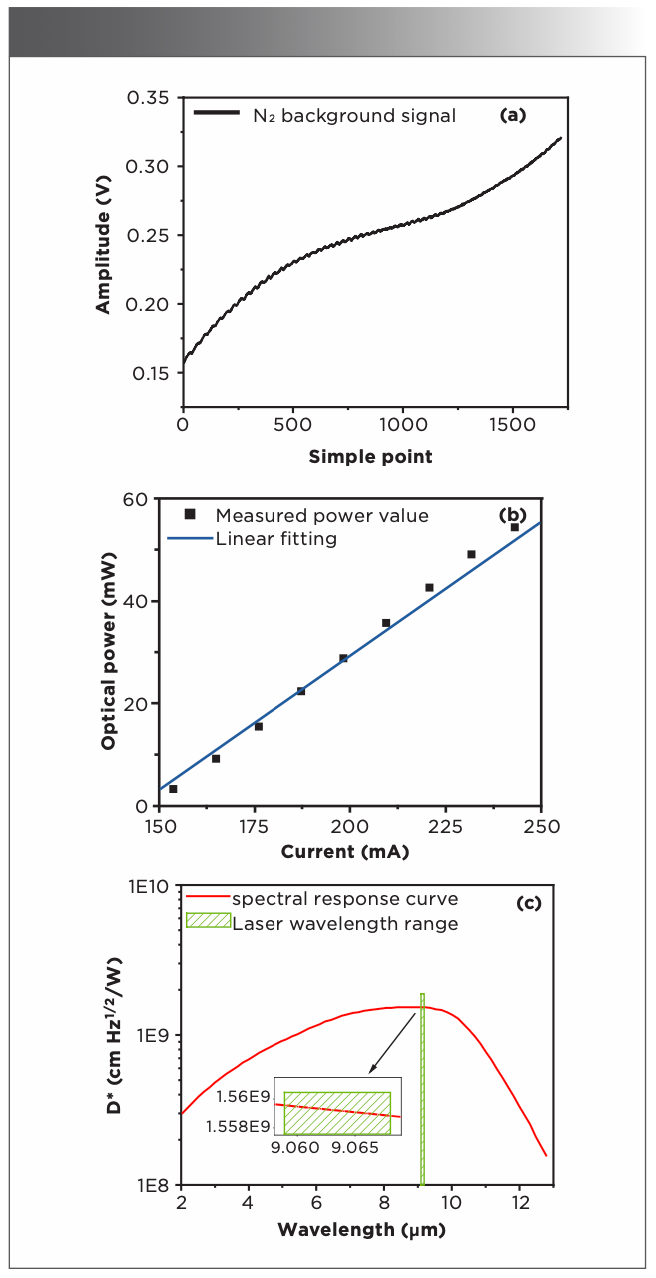
According to equation 1, the incident light intensity I0(v) is a critical variable in the detection theory of TDLAS. In experiments, it can be represented by the light intensity signal detected with the photoelectric detector when introducing pure N2 into the optical cell at atmospheric pressure.
As plotted in Figure 3a, the black solid line representing background signal shows an obvious nonlinearity, which can be explained by the following reasons. First, the nonlinear characteristics of output power gradually become prominent, along with increasing current. As illustrated in Figure 3b, the linear fit depicted by blue solid line shows that the measured output power (black solid point) is not proportional to current power levels. Secondly, Figure 3c illustrates the spectral response curve of the chosen photodetector represented by red solid line, where the detectivity (D*) is not constant within laser wavelength range (green shaded box). In addition, the system architecture and experimental environment can also have a degree of influence.

 Background signal linear fitting; (b) Comparison of linear and nonlinear fitting of laser power; and (c) Spectral response curve of photodetector.")
FIGURE 3: Background signal analysis: (a) Background signal linear fitting; (b) Comparison of linear and nonlinear fitting of laser power; and (c) Spectral response curve of photodetector.
To pick up the background signal, a nonlinear function is chosen for baseline fitting within the non-absorbing area flanking the direct absorption signal and the results of various fitting orders are achieved, as depicted in Figure 4a.

 Direct absorption signal at different fitting orders; (b) Absorbance at different fitting orders; and (c) SNR at different fitting orders.")
FIGURE 4: Selection of baseline: (a) Direct absorption signal at different fitting orders; (b) Absorbance at different fitting orders; and (c) SNR at different fitting orders.
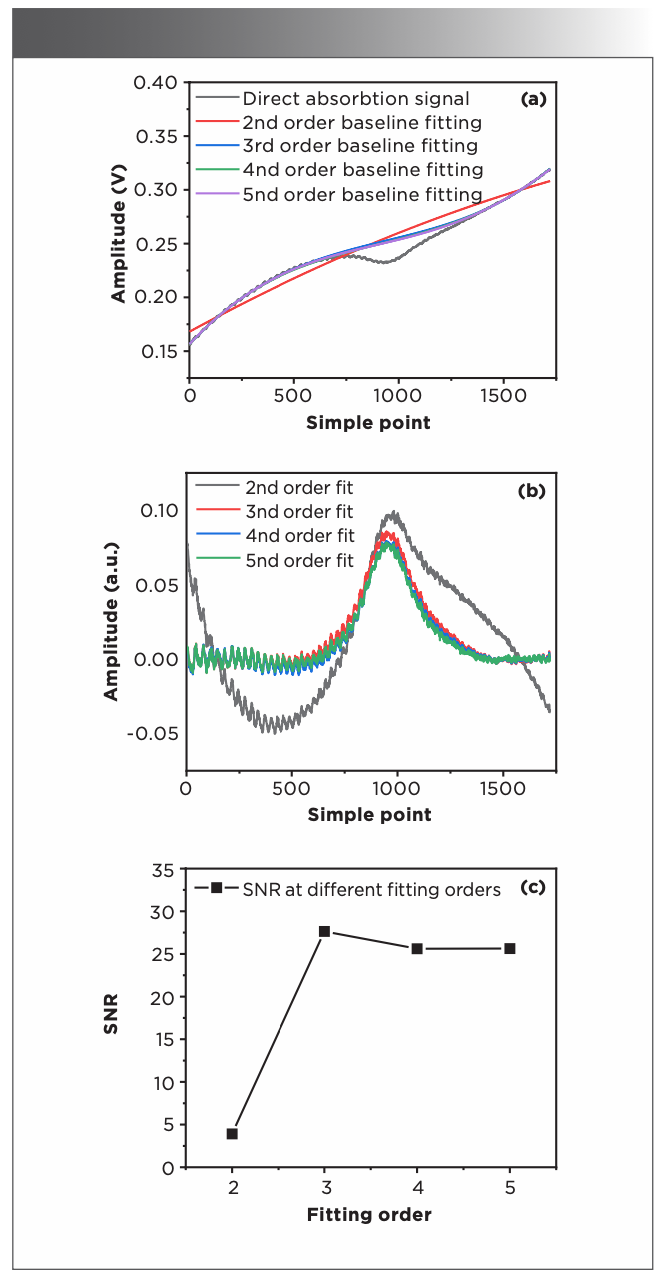
Notably, the curve of the 3rd order fit represented by the blue solid line is highly coincident with the original data in the fitting area, already achieving excellent results. The relative absorbance signal at the 3rd order exhibits a clear Lorentzian line profile in Figure 4b. Furthermore, the optimal SNR of 27.64 is also obtained at the 3rd order, as shown in Figure 4c. In conclusion, the 3rd order is chosen as the fitting order.
After deducting the background of the signal, we propose a new algorithm combining EMD with a Savitzky-Golay smooth algorithm to improve the SNR of the absorbance signal. Figure 5a exhibits the IMFs decomposed from original absorbance signal by EMD. Obviously, these IMFs incorporate varying levels of noise, which may diminish SNR and consequently impact the detection limit of the system. To suppress this impact, SG filtering is used in IMFs with a window length of 321 and 5th fit order, as shown in Figure 5b, where the noise in the first few high-frequency IMFs is attenuated apparently.

 IMF component after EMD; (b) SG filtering of IMF component; and (c) Comparison of absorbance signals with different filtering methods.")
FIGURE 5: Comparison of different methods: (a) IMF component after EMD; (b) SG filtering of IMF component; and (c) Comparison of absorbance signals with different filtering methods.
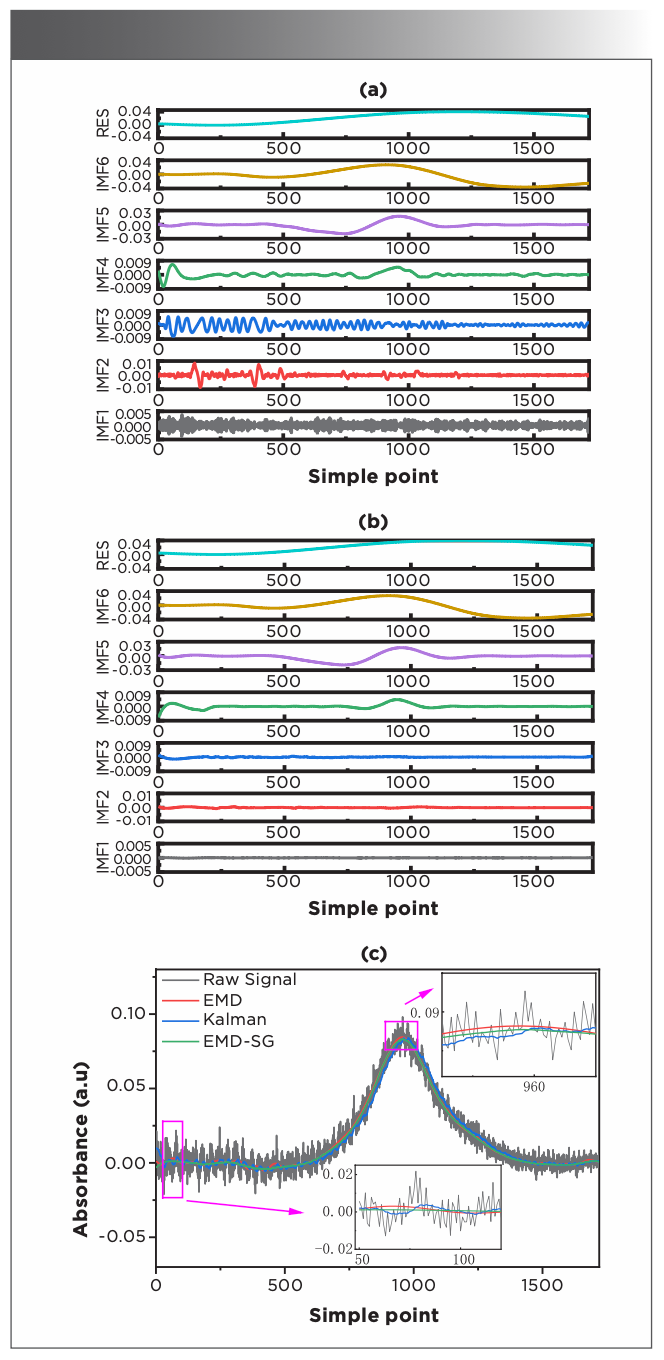
Then, the processed IMFs are screened with the energy accumulation rate and reconstructed to the final signal. As displayed in Figure 5c, the signal processed by EMD-SG algorithm (green solid line) shows the minimal fluctuation compared to common filtering methods, thereby enhancing overall stability effectively.
Table I shows the comparison of the main indexes for various filtering methods, where the EMD-SG algorithm achieves excellent results with a low root-mean-square error (RMSE) of 0.0058, an optimal SNR of 85.5, and a good correlation coefficient of 0.9745. These results confirm the effectiveness of the EMD-SG algorithm.


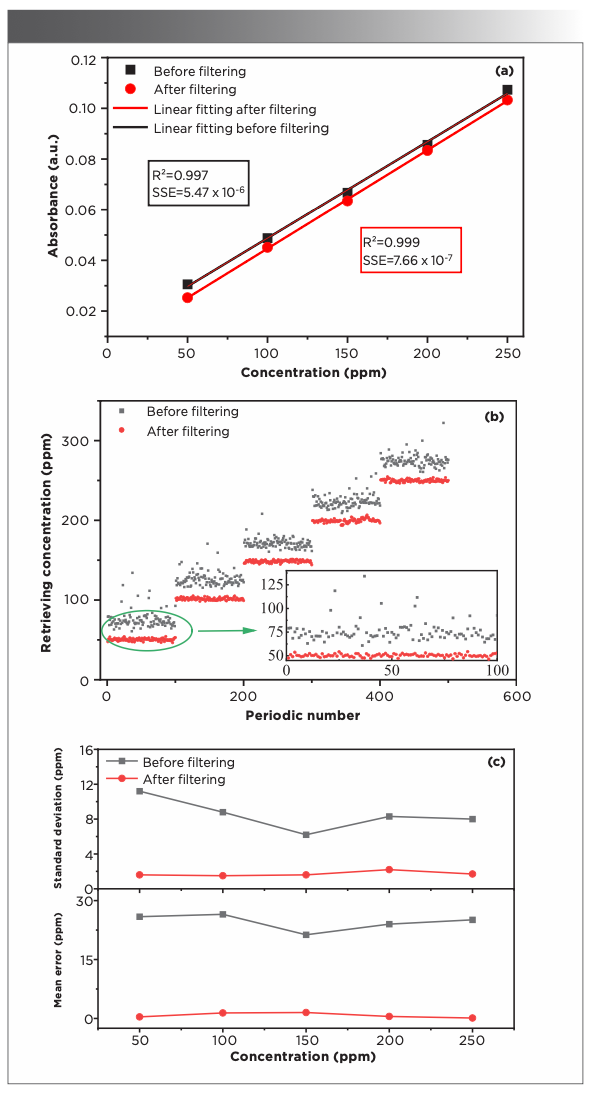
Subsequently, the various absorption signals are detected when different concentrations of NH3 are produced by a gas dilution system and fed into the optical cell at atmospheric pressure. From that, the linear relationship between different concentrations and the corresponding peak values of absorbance can be analyzed, as depicted in Figure 6a. When compared to the pre-filtering data, EMD-SG algorithm leads to a tenfold reduction in sum of squared errors (SSE) and a sensitivity of 3.886 × 10⁻⁴ a.u./ppm. Additionally, the linear fitting result depicted by the red solid line has the better linearity (R2), which can be expressed as:


To further verify the measurement accuracy of the system, a comparison of measured data at different concentrations is conducted before and after filtering. Figure 6b demonstrates a noticeable reduction in the fluctuation range of the measured concentration after applying the filtering process, as indicated by the red points. Figure 6c shows a reduction of at least 73.5% in the standard deviation. Additionally, the mean value keeps closer to the real value when utilizing a EMD-SG algorithm. Therefore, it can be concluded that the precision of the system has been significantly improved by the EMD-SG algorithm.

 Fitting curves of the peak absorbance and concentration; (b) Measured concentration; and (c) Index of different concentrations.")
FIGURE 6: Before and after filtering: (a) Fitting curves of the peak absorbance and concentration; (b) Measured concentration; and (c) Index of different concentrations.
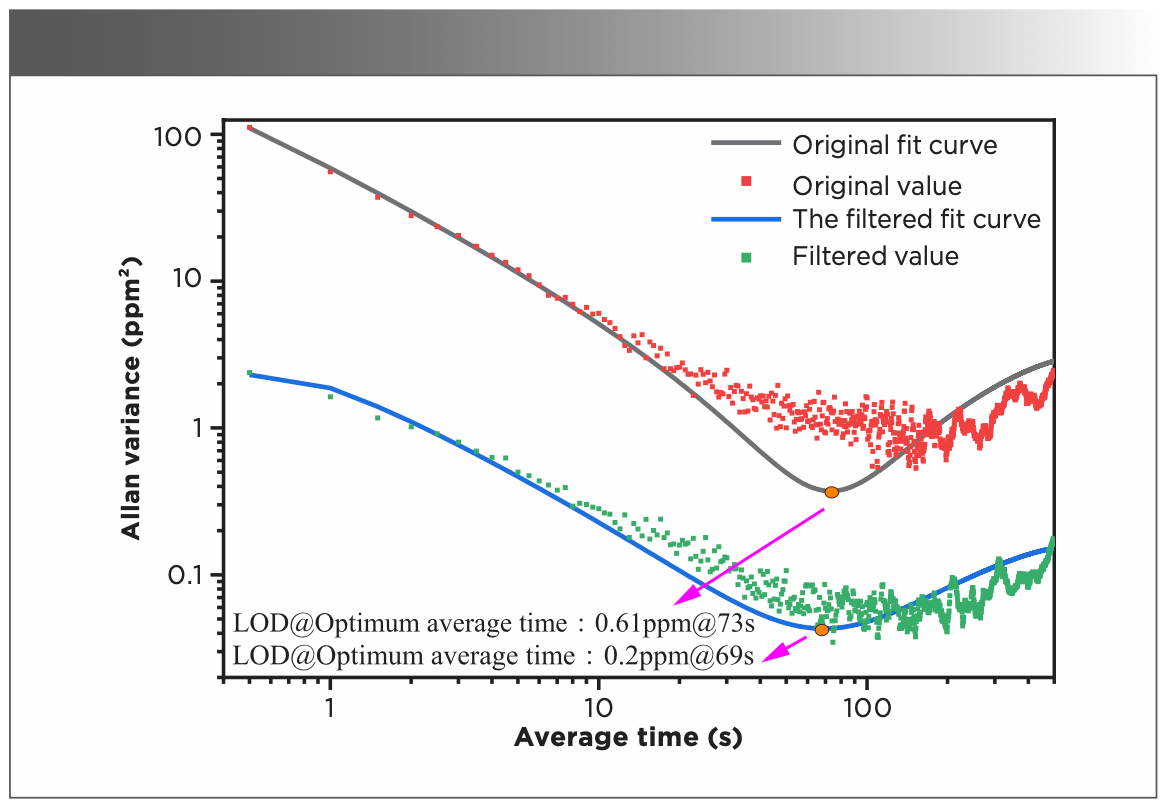
Allan variance is an important tool for quantitatively analyzing various types of noise as well as evaluating the sensitivity of the system (19). In experiments, the 50 ppm NH3 is measured with a sampling period of 0.5 s. Then, the signal peak is converted to concentrations by equation 6 and analyzed with Allan variance.
Figure 7 illustrates the relationship between Allan variance and averaging time, in which the optimal average time of the system before filtering is 73 s, resulting in a detection limit of 0.61 ppm as depicted by the black fit curve. Relatively, a detection limit of 0.2 ppm is obtained after filtering at the average time of 69 s, as represented by the blue fit curve.


FIGURE 7: Allan variance analysis.
Finally, the 50 ppm NH3 is continuously measured for 80 minutes to evaluation of the long-term measurement precision, as shown in Figure 8a. According to one data result per second, the statistical histogram is established in Figure 8b.

 measured concentration before and after filtering; and (b) measured concentration profile.")
FIGURE 8: Estimation of stability: (a) measured concentration before and after filtering; and (b) measured concentration profile.
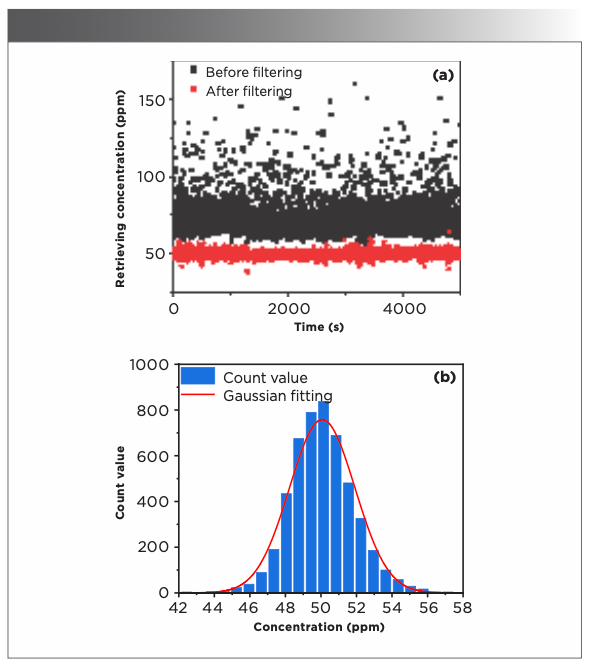
Based on the fitting curve depicted by the red solid line, the excellent Gaussian profile exists in Figure 8b, which means that the measurement noise is also Gaussian distribution. Therefore, the measurement accuracy determined by the half width at half maximum (hwhm) is 2.17 ppm. Additionally, an evident reduction occurs in concentration fluctuation after filtering, along with the mean value and standard deviation decreasing to 50.07 ppm and 1.84 ppm, respectively. These results effectively validate the exceptional stability and precision achieved by the EMD-SG algorithm in the detection system.
Conclusion
In order to meet the requirement of NH3 leakage detection in cold storage, a TDLAS detection system is constructed using a 9050 nm QCL and a straight-through optical cell. Meanwhile, a new noise reduction method that combined EMD with a SG smooth algorithm is employed to mitigate the noise in the absorbance signal. By implementing the EMD-SG filtering algorithm, the calibration fitting error of the detection system decreased by an order of magnitude. Moreover, the stability represented by the standard deviation reduced from 10.77 ppm to 1.84 ppm, resulting in a detection limit of 0.2 ppm at an average time of 69 s by Allan variance analysis. Finally, these results effectively demonstrate that EMD-SG filtering algorithms enhance both accuracy and sensitivity of the TDLAS system, so as to satisfy the detection of NH3 leakage in cold storage.
Declaration of Competing Interest
All authors have no conflicts of interest.
Acknowledgment
This research was supported by Henan Province Key R&D and Promotion Special Project (Project No.: 222102210226) and Key Research and Development Projects of Henan Province (Project No.: 221111220200).
References
(1) Jaume, F.; Alberto, C.; Sylvain, M.; et al. Hybrid System Combining Mechanical Compression and Thermochemical Storage of Ammonia Vapor for Cold Production. Energy Convers. Manage. 2019, 180, 709–723. DOI: 10.1016/j.enconman.2018.11.019
(2) Ji, J.; Chen, X. X.; Han, X. F. Rapid Simulation and Visualization Analysis of Liquid Ammonia Tank Leakage Risk. Procedia Eng. 2014, 84, 682–688. DOI: 10.1016/j.proeng.2014.10.486
(3) Nie, W.; Kan, R. F.; Yang, C. G.; et al. Research Progress on the Application of Tunable Diode Laser Absorption Spectroscopy. Chin. J. Lasers 2018, 45 (9), 9–29.
(4) Deng, BT.; Sima, C.; Xiao, Y. F.; et al. Modified Laser Scanning Technique in Wavelength Modulation Spectroscopy for Advanced TDLAS Gas Sensing. Opt. Lasers Eng. 2022, 106906. DOI: 10.1016/j.optlaseng.2021.106906
(5) Li, J. Y.; Zhang, C. G.; Wei, Y. Y.; et al. In situ, Portable and Robust Laser Sensor for Simultaneous Measurement of Ammonia, Water Vapor and Temperature in Denitrification Processes of Coal Fired Power Plants. Sens. Actuators, B 2020, 127533 DOI: 10.1016/j.snb.2019.127533
(6) Zhang, Z. F.; Zou, D. B.; Chen, W. L.; et al. Detection of Escaping NH3 Based on TDLAS with Multi-pass Cells. J. Optoelectron., Laser. 2013, 24 (12), 2367–2371.
(7) Guo, X. Q.; Zheng, F.; Li, C. L.; et al. A Portable Sensor for In-Situ Measurement of Ammonia Based on Near-Infrared Laser Absorption Spectroscopy. Opt. Lasers Eng. 2019, 115, 243–248. DOI: 10.1016/j.optlaseng.2018.12.005
(8) Lu, H. B.; Zheng, C. T.; Zhang, L.; et al. A Remote Sensor System Based on TDLAS Technique for Ammonia Leakage Monitoring. Sensors-Basel. 2021, 21 (7). DOI: 10.3390/s21072448
(9) Meng, Y. X.; Liu, T. G.; Liu, K.; et al. A Modified Empirical Mode Decomposition Algorithm in TDLAS for Gas Detection. IEEE Photonics J. 2014, 6 (6), 1–7. DOI: 10.1109/JPHOT.2014.2368785
(10) Qi, R. B.; He, S. K.; Li, X. T.; Wang, X. Z. Simulation of TDLAS Direct Absorption Signal Based on HITRAN Spectral Database. Spectrosc. Spectral Anal. 2015, 35 (1), 172–177. DOI: 10.3964/j.issn.1000-0593(2015)01-0172-06
(11) Li, J. S.; Yu, B. L.; Zhao, W. X.; Chen, W. D. A Review of Signal Enhancement and Noise Reduction for Tunable Diode Laser Absorption Spectroscopy. Appl. Spectrosc. Rev. 2014, 49 (8), 666–691. DOI: 10.1080/05704928.2014.903376
(12) Duan, H.; Gautam, A.; Shaw, B. D.; Cheng, H. H. Harmonic Wavelet Analysis of Modulated Tunable Diode Laser Absorption Spectroscopy Signals. Appl. Opt. 2009, 48 (2), 401–407. DOI: 10.1364/AO.48.000401
(13) Zheng, F.; Qiu, X. B.; Shao, L. G.; et al. Measurement of Nitric Oxide From Cigarette Burning Using TDLAS Based on Quantum Cascade Laser. Opt. Laser Technol. 2020, 105963. DOI: 10.1016/j.optlastec.2019.105963
(14) Li, J. S.; Deng, H.; Li, P. F.; Yu, B. L. Real-time Infrared Gas Detection Based on an Adaptive Savitzky-Golay Algorithm. Appl. Phys. B. 2015, 120 (2), 207–216. DOI: 10.1007/s00340-015-6123-z
(15) Huang, NE.; Shen, Z.; Long, SR.; et al. The Empirical Mode Decomposition and the Hilbert Spectrum for Nonlinear and Non-Stationary Time Series Analysis. Proceedings of the Royal Society A: Mathematical, Phys. Eng. Sci. Med. 1998, 454 (1971), 903–995. DOI: 10.1098/rspa.1998.0193
(16) Du, Z. H.; Li, J. Y.; Cao, X. H.; Cao, H.; Ma, Y. W. High-Sensitive Carbon Disulfide Sensor Using Wavelength Modulation Spectroscopy in the Mid-Infrared Fingerprint Region. Sens. Actuators, B 2017, 247, 384–391. DOI: 10.1016/j.snb.2017.03.040
(17) Zhao, G. Y.; Deng, Q. L.; Li, X. B.; et al. Recognition of Microseismic Waveforms Based on EMD and Morphological Fractal Dimension. J. Cent. South Univ. 2017, 48 (1), 162–167. DOI: 10.11817/j.issn.1672-7207.2017.01.023
(18) Liu, X. N.; Qiao, S. D.; Ma, Y. F. Highly Sensitive Methane Detection Based on Light-Induced Thermoelastic Spectroscopy with a 2.33 µm Diode Laser and Adaptive Savitzky-Golay Filtering. Opt. Express. 2022, 30 (2), 1304–1313. DOI: 10.1364/OE.446294
(19) Wang, S. L.; Gong, W. H.; Wang, Z. W.; et al. Interference Fringe Suppression in Tunable Diode Laser Absorption Spectroscopy Based on CEEMDAN-WTD. Front. Phys. 2022, 10. DOI: 10.3389/fphy.2022.1057519
Wei Zhou, Zhengqiao He, Tenghui Wang, and Lei Li are with the School of Physics and Microelectronics, at Zhengzhou University, in Zhengzhou, China. Rubin Qi and Jinfeng Ding are with the College of Electrical and Information Engineering at the Zhengzhou University of Light Industry, in Zhengzhou, China. Xianzhong Wang, Shukai He, and Xintian Li are with Henan Relations Co., Ltd., Zhengzhou, China. ●


Newsletter
Get essential updates on the latest spectroscopy technologies, regulatory standards, and best practices—subscribe today to Spectroscopy.


 © stockyme -chronicles-stock.adobe.com")
How Analytical Chemists Are Navigating DOGE-Driven Funding Cuts
July 14th 2025DOGE-related federal funding cuts have sharply reduced salaries, lab budgets, and graduate support in academia. Researchers view the politically driven shifts in priorities as part of recurring systemic issues in U.S. science funding during administrative transitions. The impact on Federal laboratories has varied, with some seeing immediate effects and others experiencing more gradual effects. In general, there is rising uncertainty over future appropriations. Sustainable recovery may require structural reforms, leaner administration, and stronger industry-academia collaboration. New commentary underscores similar challenges, noting scaled-back graduate admissions, spending freezes, and a pervasive sense of overwhelming stress among faculty, students, and staff. This article addresses these issues for the analytical chemistry community.

Drone-Mounted Infrared Camera Sees Invisible Methane Leaks in Real Time
July 9th 2025Researchers in Scotland have developed a drone-mounted infrared imaging system that can detect and map methane gas leaks in real time from up to 13.6 meters away. The innovative approach combines laser spectroscopy with infrared imaging, offering a safer and more efficient tool for monitoring pipeline leaks and greenhouse gas emissions.


