SPEC PerkinElmer 10.13
News|Articles|June 26, 2026

Microplastics Found in All Commercial Salt Samples Tested in South Sumatra Study

Listen
0:00 / 0:00

Key Takeaways

  • Universal contamination across sampled brands suggests table salt can be a consistent, low-dose microplastic exposure vector in populations with daily use.
  • Fragment-dominant particles at 50–300 μm highlight detection challenges and potential limitations of standard production filtration and inspection approaches.
SHOW MORE

Researchers detect up to 587 particles per kilogram in locally marketed table salt, raising questions about daily consumer exposure through a dietary staple.

Commercial table salt may contain more microplastic contamination than originally believed, according to a recent study published in the journal Tropical Oceanographic Research Frontiers.1

In a recent study, researchers at Sriwijaya University in Indonesia detected microplastic contamination in every sample of commercial table salt that they in Sungsang Village, Banyuasin Regency, South Sumatra, Indonesia. The findings add to an expanding body of scientific literature indicating that edible salt, one of the most universally consumed food products, may serve as a consistent route of human microplastic ingestion.

What are microplastics and why is it important that researchers detect them in food items?

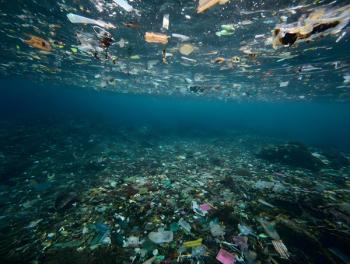
Microplastics are tiny particles of plastic that are 5 mm or less in size.2,3 Because these particles are small, they are often difficult to detect out in the environment and in food. Although these particles are not poisonous and in small quantities relatively harmless, their accumulation in food can lead to more serious health concerns. For example, if enough microplastics enter the human body, health issues such as organ dysfunction and metabolic disorders.4,5

What did the authors do in their study?

In the study, the research team analyzed two locally marketed salt brands using density separation, vacuum filtration, and microscopic examination. Microplastic concentrations ranged from 513 to 587 particles per kilogram across all samples tested, with fragment-shaped particles representing the most common particle type identified.1

Did the particle sizes raise concerns over detection and absorption?

The majority of particles fell within the 50–300 micrometer size range, placing them in the smaller end of the microplastic spectrum.1 This size distribution is important because particles in this range are less visible to consumers and may present distinct challenges for standard food-safety filtration and detection methods during production.1


Although the study did not assess biological uptake or health outcomes directly, the authors noted that based on average salt consumption rates, consumers could be continuously exposed to microplastics through routine daily use of table salt.1 That exposure pathway, if confirmed across broader populations and geographies, has implications for both public health monitoring and food safety regulation.1

According to the study's authors, contamination may have occurred at multiple stages across the production and distribution chain. The microplastics could have been come from the marine or coastal source environment where the salt is harvested, or through the processing, packaging, and retail processes.1

Sungsang Village sits within Banyuasin Regency, a coastal area of South Sumatra where marine and estuarine environments are integral to local salt production. The researchers point to poor plastic waste management in coastal zones as a probable contributing factor, consistent with broader findings from other microplastic studies conducted across Southeast Asia and beyond.1

What are the main takeaways from this study?

There are several key takeaways that the public can take from this study. For example, microplastic contamination can occur at any time in the production process; it can but doesn’t necessarily have to originate from the original source. As a result, routine monitoring of microplastic contamination at every stage is critical. This process might involve inspecting the salt more closely, but the authors frame these as necessary steps to reduce the entry of plastic particles into the marine food chain and, by extension, into food products derived from it.1

Meanwhile, the study has implications for industry stakeholders. For those in food manufacturing, particularly salt producers, the study presents a clear signal that current oversight frameworks may need to be revisited in light of accumulating evidence that current regulatory oversight is not adequate.1

References
  1. Purwiyanto, A. I. S.; Saputra, R. H.; Putri, W. A. E., Rozirwan, & Melki. Abundance and Characterization of Microplastics in Marketed Edible Salt from a Coastal Region of South Sumatra, Indonesia. Trop. Oceanogr. Res. Front. 2026, 1 (2), 74−88. DOI: 10.53623/torf.v1i2.1013
  2. Wetzel, W. Detecting Environmental Microplastics and Nanoplastics With Spectroscopy. Spectroscopy. Available at: https://www.spectroscopyonline.com/view/detecting-environmental-microplastics-and-nanoplastics-with-spectroscopy (Accessed June 22nd, 2026).
  3. Workman, Jr., J. A Review of Spectroscopic Techniques used for the Quantification and Classification of Microplastics and Nanoplastics in the Environment. Spectroscopy. Available at: https://doi.org/10.56530/spectroscopy.ac7567r4 (Accessed June 22nd, 2026).
  4. Wetzel, W. Detection of Microplastics in Bottled Water Using Raman Microspectroscopy. Spectroscopy. Available at: https://www.spectroscopyonline.com/view/detection-of-microplastics-in-bottled-water-using-raman-microspectroscopy (Accessed June 22nd, 2026).
  5. Li, Y.; Tao, L.; Wang, Q.; Wang, F.; Li, G.; Song, M. Potential Health Impact of Microplastics: A Review of Environmental Distribution, Human Exposure, and Toxic Effects. Environ. Health 2023, 1 (4), 249–257. DOI: 10.1021/envhealth.3c00052.

Related to this article

Infrared Reimagined: How FT-IR Spectroscopy Learned to Read Molecules, ©  Luis Eduardo  -chronicles-stock.adobe.com
FT-IR spectroscopy, long treated as a mature bench technique for confirming a carbonyl stretch or fingerprinting a polymer, has quietly become one of chemistry’s most versatile discovery engines: it now infers molecular structure straight from a spectrum without a reference library, resolves chemistry tens of nanometers wide, and screens a fingerstick of blood for disease in minutes. The last five years of published research show FT-IR moving from a confirmatory tool into a predictive, autonomous, and field-ready analytical platform.
Brandon E. Boor is the Dr. Margery E. Hoffman Associate Professor in the Lyles School of Civil and Construction Engineering at Purdue University. | Photo Credit: © Brandon Boor.
In the second part of our interview with Brandon Boor of Purdue University, he discusses how his team controls experimental variables during cleaning experiments in order to obtain interpretable data.
Sizing Up the Nanoscale: Measuring Nanocluster Aerosol in Indoor Air
In the first part of a multi-part Q&A, Brandon Boor, the Dr. Margery E. Hoffman Associate Professor in the Lyles School of Civil and Construction Engineering at Purdue University, describes the instrumentation and methodology behind measuring nanoparticle size distributions at the nanocluster scale (1–3 nm) and outlines the technical challenges of acquiring reliable, real-time data at these dimensions.
NIR Spectroscopy of the Brain and Other Complex Analyses, ©   Navaporn  -chronicles-stock.adobe.com
Near-infrared spectroscopy has quietly stopped being a niche calibration exercise and started acting like an autonomous diagnostic partner, reading consciousness in an injured brain, steering a fermenter without a human hand, and hunting invisible plastic in a glass of water. The tool chemists once used to check moisture in grain is now fusing with artificial intelligence to make decisions no spectrometer could make alone.