News|Articles|April 7, 2026

Spectroscopy

  • March/April 2026
  • Volume 41
  • Issue 02
  • Pages: 16–21

New Product Advances in Vibrational and Atomic Spectroscopy (2025–2026)

Listen
0:00 / 0:00

Key Takeaways

  • AI- and chemometric-driven workflows increasingly enable automated baseline correction, peak assignment, interference removal, classification, and quantitative prediction, reducing operator dependence while improving reproducibility in complex matrices.
  • Miniaturized, portable Raman and NIR platforms with embedded models are expanding in situ decision-making for QC, safety, forensics, and process monitoring, often via mobile/cloud-enabled interfaces.
SHOW MORE

Spectroscopy is rapidly evolving into an integrated, intelligent ecosystem where advances in instrumentation, detectors, and optics—combined with chemometrics and artificial intelligence (AI)—are enabling higher sensitivity, miniaturization, multimodal analysis, and real-time decision-making across techniques ranging from ultraviolet–visible (UV–vis), infrared (IR), and Raman to inductively coupled plasma mass spectrometry (ICP-MS), laser-induced breakdown spectroscopy (LIBS), and X-ray fluorescence (XRF). Together, these developments are driving automation, predictive modeling, and the emergence of autonomous analytical laboratories with increasingly connected, cloud-enabled workflows.

Spectroscopy instrumentation and software are transitioning to intelligent, interconnected analytical ecosystems. Advances in detection, optics, and software across electronic, vibrational, atomic, and imaging spectroscopy have resulted in higher sensitivity, miniaturized and portable platforms, and multimodal capabilities. New technologies such as quantum-enhanced detectors, ultrafast electronics, high-power lasers, and artificial intelligence (AI)-driven predictive analytics have transformed instrument performance. Simultaneously, chemometric and AI-driven tools are enabling predictive modeling, automated classification, and real-time process analytics. This review synthesizes major developments in spectroscopy systems and software from 2025 to 2026 and discusses emerging trends toward autonomous analytical laboratories.

The 2025 to 2026 period marks a transformative phase in analytical spectroscopy,1 characterized by a convergence of high-performance instrumentation components and computers, chemometrics, and artificial intelligence (AI).2 Our new product review includes instrumentation selected as unique, new, or improved for vibrational, molecular, and atomic spectroscopy.

Analytical techniques covered include ultraviolet-visible (UV-vis), infrared (IR), Raman,2 near-infrared (NIR), terahertz (THz), nuclear magnetic resonance (NMR), and hyperspectral imaging (HSI). Also included are atomic spectroscopy techniques3 such as inductively coupled plasma-optical emission spectroscopy (ICP-OES), inductively coupled plasma-mass spectrometry (ICP-MS), laser ablation-inductively coupled plasma-mass spectrometry (LA-ICP-MS), atomic absorption spectroscopy (AAS), atomic emission spectroscopy (AES), laser-induced breakdown spectroscopy (LIBS), and X-ray fluorescence (XRF). Instrument manufacturers have introduced systems emphasizing automation, miniaturization, and reduced footprint, connectivity, and real-time analytical decision-making. This period has also seen the development of advanced detector technologies, novel laser sources, quantum-enhanced instrumentation, and cloud-based or AI-based data analytics. These advances improve speed, precision, quantitative and qualitative analysis capabilities, and automated workflows.

Spectroscopy remains indispensable for chemical, biological, and material analysis. Recent technological trends reflect 3 dominant forces:

  1. Integration of AI-based or advanced chemometrics: enabling automated interpretation, enhanced predictive and classification analytics, and system anomaly detection.
  2. Miniaturization and field-deployable instrumentation: allowing in situ and online measurements across manufacturing and natural products industries.
  3. Multimodal and hyphenated systems: combining spectroscopy techniques and extended data ranges with advances in imaging techniques, chromatography data, or NMR data for richer datasets.

Industry 4.0 integration4 has accelerated real-time process analytics, connecting spectrometers to cloud-based workflows, predictive modeling engines, and digital twins. Portable Raman and NIR systems now routinely incorporate embedded AI-based chemometric models for classification and quantitative analysis.4 Advances in photonics, including high-resolution diffraction gratings, enhanced interferometers, tunable laser diodes, and quantum-enhanced detectors, are enabling next-generation spectroscopy platforms with unprecedented sensitivity and speed.

Leading companies for new spectroscopy instrument trends include: ABB Measurement & Analytics (https://new.abb.com/products/measurement-products), Agilent Technologies (https://www.agilent.com), Bruker Corporation (https://www.bruker.com), Thermo Fisher Scientific (https://www.thermofisher.com), and Shimadzu Corporation (https://www.shimadzu.com)—have expanded portfolios to meet growing needs in pharmaceutical, environmental, industrial, and biomedical applications. Recent software and AI integration, including SIMCA (Sartorius, https://www.sartorius.com), PLS_Toolbox (Eigenvector Research, https://eigenvector.com), Unscrambler X (CAMO Analytics, https://www.camo.com), MATLAB (MathWorks, https://www.mathworks.com), and Python-based frameworks (https://www.python.org), as well as Wiley KnowItAll databases (https://www.wiley.com), are reshaping workflows for spectral interpretation, predictive modeling, and automation. See the References and Further Reading section for selected company listings and Uniform Resource Locators (URLs).

Electronic Spectroscopy

UV-Vis Spectroscopy

UV-vis instruments have benefited from advancements in diode array detectors, low-noise electronics, and high-resolution optical systems. Modern instruments now include high-speed scanning, AI-assisted baseline correction, and automated wavelength calibration.

  • Agilent Technologies Cary 60 UV-Vis (https://www.agilent.com/): Cary WinUV Software for UV-vis applications. Enhanced photometric linearity, automated method development, and temperature-controlled sample holders allow unattended multisample workflows. Perform accurate wavelength scans and reads, kinetics and concentration analysis, and control a range of sampling accessories, including the 18-cell multicell changer. Included algorithms improve peak detection in overlapping spectra and are able to model complex matrix interferences.
  • Shimadzu UV-1900i Plus (https://www.shimadzu.com/): High-speed scanning (29,000 nm/min) and ultralow stray light improve sensitivity for trace analysis. Innovations in monochromator design and high-efficiency photodiodes reduce measurement noise. Complies with Pharmacopeia standards (JP, USP, EP).
  • ABB Measurement & Analytics Process UV Analyzers, Multiwave photometer PUV3402 (https://new.abb.com/products/measurement-products): Inline process monitoring with fiber-optic probes and AI-based predictive algorithms allows real-time adjustments in chemical processes, reducing waste and improving yield. VistaNET and VistaSTAR connectivity.

Trends include integrating cloud-based predictive maintenance and real-time quality control systems to enable continuous process improvement.

Fluorescence Spectroscopy

Fluorescence spectroscopy continues to expand in sensitivity, temporal resolution, and miniaturization. Time-resolved and hypersensitive detectors now allow single-molecule detection and ultrafast kinetic studies.

  • HORIBA Fluorolog-QM (https://www.horiba.com/): Offers sub-nanosecond time-resolved fluorescence, advanced lifetime imaging, and multiwavelength excitation. AI-driven spectral deconvolution and automated lifetime analysis reduce human error and improve reproducibility. Emission range 185 to 900 nm (optional to 5500 nm) at a step size of 0.01 nm.
  • Emerging technologies: include single-photon avalanche diodes (SPADs), high-throughput plate readers with integrated AI analysis, and microfluidic integration for rapid biochemical assays.

Applications include biomarker discovery, environmental contaminant detection, and drug development assays where ultrasensitive detection and rapid data interpretation are critical.


Vibrational Spectroscopy

Raman Spectroscopy

Raman spectroscopy has benefited from high-stability lasers, low-noise detectors, and AI-enabled data processing. New laser sources, including fiber and diode-pumped solid-state lasers, have extended measurement ranges and improved safety for delicate biological samples. AI integration enables Raman spectroscopy to address challenges in pharmaceuticals, food safety, and materials science, improving classification accuracy and enabling automated interpretation.

  • B&W Tek (A Metrohm Group Company) DIY‑Raman NxG / Duo (https://bwtek.com/): High-sensitivity, multi-excitation platforms enabling real-time insight into functional groups, reaction pathways, and polymorph transitions. Preconfigured discover-it-yourself (DIY) systems include Raman, low-frequency Raman, extended range Raman, and UV-Vis-NIR spectroscopy.
  • Cobolt Disco™ 785 nm Laser (https://hubner-photonics.com/): Single-frequency TEM00 beam up to 500 mW, <100 kHz linewidth, high spectral purity (>70 dB), enabling ultra‑low‑frequency Raman and Brillouin measurements.
  • Metrohm i-Raman Plus next generation, powered by the flexible SpecSuite software, delivers research-grade Raman spectroscopy with high spectral resolution and a wide spectral range, enabling detailed, easy-to-interpret data collection down to 6 cm⁻¹. Available with 532 and 785 nm excitation options, it supports a broad range of applications from university teaching to advanced materials research.
  • Metrohm MIRA and MISA Mk2 (https://www.metrohm.com/): Including Metrohm Instant Raman Analyzer (MIRA) and Metrohm Instant SERS Analyzer (MISA). Handheld Raman for non-technical users with Smart Attachments, guided workflows, color-coded results, Orbital Raster Scan for sensitive samples, and stand-off analysis to ~3 m.
  • Oxford Instruments witec360 Raman Microscope (https://raman.oxinst.com/): Successor to the alpha300 series with improved light transmission, polarization control, automated white-light/Raman switching, and modular integration (photoluminescence [PL], second-harmonic generation [SHG], time-correlated single photon counting [TCSPC], atomic force microscopy [AFM], and profilometry). Product page: https://raman.oxinst.com/products/raman-microscopes/witec360
  • Renishaw inVia Confocal Raman Microscopes (https://www.renishaw.com/): Submicron spatial resolution with automated focus adjustments. Innovations in detector cooling and confocal optics enhance sensitivity while reducing background noise. The inVia microscope employs LiveTrack automated focus-tracking technology to capture accurate, repeatable spectra and topographical data in real time, even from samples with significant height variations. It also enables high-quality 3D imaging of uneven, curved, or rough surfaces without requiring prescanning.

FT-IR/Mid-IR Spectroscopy

Fourier-transform infrared (FT-IR) systems continue to evolve with enhanced sensitivity, detector performance, and automation. Quantum-enhanced FT-IR technologies are emerging, promising further improvements in sensitivity and dynamic range.

  • Anton Paar Lyza 7000 and 3000 FT-IR (https://www.anton-paar.com/): Modular cell concept for diverse samples; long-life optics with extended warranties; guided workflows with Spectroscopy Suite and adherence options with touchscreen interface.
  • Bruker INVENIO (https://www.bruker.com/): Vacuum optics, high signal-to-noise (S/N) ratio, and advanced automation enable rapid mapping and imaging for both routine QC and research applications. The system supports mid-IR and far-IR spectroscopy, as well as high-speed ATR measurements. Spectral range expansion from FIR to UV-VIS; Spectral resolution down to< 0.085 cm-1 with simultaneous far-infrared (FIR) and mid-infrared (MIR) measurements.
  • NLIR MIDWAVE Spectrometer (2.0–5.0 µm) (https://nlir.com/): 10× responsivity improvement with compact design for lab/industrial use. High sensitivity of 5 pW/nm, and the full-spectrum readout rate of 400 Hz.
  • PerkinElmer Spotlight Aurora-I FTIR Microscope (https://www.perkinelmer.com/): Incorporates high-sensitivity detectors and automated sampling accessories for solid, liquid, and gas samples, supporting high-throughput analysis in pharmaceutical and polymer laboratories. Advanced automation, real-time spectral matching, and high-sensitivity ATR.
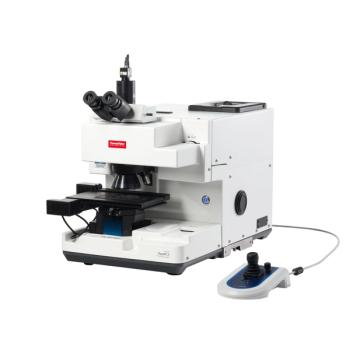
  • Thermo Scientific Nicolet Summit OA FTIR Spectrometer (https://www.thermofisher.com/): Cloud-enabled OMNIC software allows remote access, AI-assisted spectral search, and predictive analysis for chemical identification. Determines the infrared spectrum of absorption or emission of solid, liquid, or gas samples.

Near-Infrared (NIR) Spectroscopy

NIR spectroscopy is increasingly applied in agriculture, pharmaceuticals, and process analytics due to its rapid, nondestructive measurement capabilities and improvements in chemometrics software, including machine language (ML) and other AI techniques.

  • Malvern Panalytical ASD FieldSpec 4 (https://www.malvernpanalytical.com/): Field-deployable UV-vis, near-infrared (NIR), and short-wave infrared (SWIR) spectroradiometers with ruggedized probes enable soil, crop, and food analysis. Integration with AI models allows real-time decision-making for agronomic optimization.
  • Miniature AI-Enabled NIR Spectrometers: Ultra-compact, off-the-shelf device with mobile app integration for library building, training, and identification of unknowns. Applications include anti-counterfeit beverages, explosives precursors, clandestine drug detection, microbial contamination, forensic fluids, recycling streams, and biometric/sub-dermal vein analysis.
  • Si-Ware Systems Portable NIR (NeoSpectra) (https://www.si-ware.com/): NIR wavelength(1350–2550 nm) system in compact form.
  • Spectral Engines NIRONE (https://spectralengines.com/): Battery-powered device with Bluetooth connectivity for mobile phones and tablets. The micro-USB connection is used for charging and communication with Sensor Control. Available in 4 configurations from 1.35 to 2.45 µm spectral ranges .
  • Ocean Insight Compact NIR Spectrometers (https://www.oceaninsight.com/): Embedded systems suitable for inline process control, with low-power designs and AI-assisted spectral interpretation. Compact and ultracompact spectrometers in 3 wavelength ranges: 185–650 nm, 350–810 nm, and 645–1085 nm.
  • Teledyne Vision Systems (https://www.teledynevisionsolutions.com/): Includes imaging cameras using new indium-galium-arsenide (InGaAs) detectors for higher sensitivity and broader spectral analysis in industrial environments.

Terahertz (THz) Spectroscopy

THz spectroscopy, an emerging field, combines spectroscopy with imaging for material characterization and security applications. Innovations include high-power THz quantum cascade lasers and ultrafast detectors.

  • Improvements: Research focuses on improving source power, detector sensitivity, and integration with automated sample handling systems, expanding applications in inspection, non-destructive testing, chemical identification, and analysis.
  • Bruker VerTera and VERTEX 80/80v FT-IR spectrometers (https://www.bruker.com/): Capable of accessing the THz range down to 5 cm-1 (~0.15 THz).
  • HÜBNER Photonics T-COGNITION® THz spectrometer (https://hubner-photonics.com/). Used for inspection of mail for hidden objects

Nuclear Magnetic Resonance (NMR)

NMR instrumentation is becoming more accessible, with benchtop and compact high-field systems incorporating AI-assisted automation for shimming, spectral acquisition, and data interpretation.

  • Improvements: AI integration allows automated spectral deconvolution, peak assignment, and kinetic monitoring for chemical reactions.
  • JEOL ECZL Series (https://www.jeol.com/): The S, RR, and G series operate at 400 MHz, 400 to 600 MHz, and 400 MHz to 1.3 GHz, respectively. Compact high-field NMR with enhanced magnet stability, automated sample handling, and advanced DELTA and JASON control and spectral analysis software for complex instrument control and data management for sample analysis and mixture characterization.
  • Nanalysis-60 NMReady NMR spectrometer systems (https://www.nanalysis.com/): Benchtop NMR systems for routine analysis in academic and industrial labs, with automated pulse sequences and embedded data processing. Nuclei: 1H/19F, 1H/19F/13C, 1H/19F/7Li, 1H/19F/31P; Operating Frequency: 60 MHz (1.40 T).

Hyperspectral Imaging (HSI)

HSI merges spectroscopy with imaging, providing spatially resolved chemical information. Recent developments include high-speed sensors, AI-assisted image analysis, and integration with machine vision systems.

  • Emerging technologies: Include real-time chemometric image analysis and high-throughput HSI for industrial automation.
  • Jasco IRT‑7X Multichannel Infrared Microscope (https://www.jasco-global.com/): High-definition IR imaging using high-speed linear array detectors and advanced digital processing for materials and contaminant analysis. MCT detector, a second detector can be added as an option. IQ Mapping allows single-point, multi-point, line, area, and ATR mapping measurements without moving the sample stage. Uses 5M pixels high-resolution camera.
  • Ocean Insight HSI Sensors (https://www.oceanoptics.com/): High-speed imaging sensors for machine vision, food quality assessment, and environmental monitoring. Embedded AI models allow automated classification and contaminant detection. Available in three ranges: 185–650 nm,350–810 nm, and 645–1085 nm, with optical resolution (FWHM) of 2.2 nm.
  • Zeiss LSM 990 for HSI Fluorescence Imaging Microscopy (https://www.zeiss.com/): Covers a wavelength range from 380 to 900 nm for use with fluorescence dye imaging experiments. Combines optical microscopy with hyperspectral analysis for biomedical applications, enabling single-cell chemical profiling and tissue mapping.

Atomic Spectroscopy

ICP-OES/ICP-MS

Atomic spectroscopy platforms are incorporating enhanced detection, automation, and AI-based interference correction.

  • Agilent 7850 ICP-MS (https://www.agilent.com/): Advanced interference removal with collision/reaction cell technology and automated tuning. Uses ICP-MS MassHunter software. Implements Ultra High Matrix Introduction (UHMI), enabling direct analysis of samples containing up to ~25% total dissolved solids without dilution by using controlled aerosol dilution to reduce matrix loading on the plasma.
  • Analytik Jena PlasmaQuant 9200 ICP-OES ((https://www.analytik-jena.com/): High resolution, broad spectral range, up to 1700 W plasma power, compact footprint, and rapid start-up (<10 min). Resolution of 2 pm @ 200 nm and best detection limits with long-term stability.
  • ·PerkinElmer Avio 3000 ICP-OES: The 3 main sub-systems—plasma, optics, and detector—all have been redesigned for optimum performance and efficiency. Designed for robust, multi-element analysis with excellent sensitivity and stability across complex sample matrices. It features advanced plasma technology and optimized sample introduction for efficient operation, high throughput, and reliable results with minimal maintenance.
  • SPECTRO SPECTROGREEN MS (https://www.spectro.com/): New quadrupole ICP-MS platform with digital integration and AI-assisted predictive modeling for routine elemental analysis. Designed to deliver high sensitivity, stability, and broad analytical capability for routine environmental, pharmaceutical, and consumer product testing. It combines a high-matrix interface and gas dilution system with easy-to-use software and a low-maintenance design for efficient, reliable operation
  • Thermo Fisher iCAP RQplus ICP-MS: High-throughput, low-detection-limit analysis suitable for complex matrices with cloud-connected data management. Designed to deliver accurate trace element analysis across all sample matrices with high stability and minimal drift, supported by advanced argon gas dilution technology. Features such as the EasyClick peristaltic pump and Hawk monitoring are designed for smooth sample handling, high throughput, and efficient, low-downtime operation.

LIBS and XRF

  • Applied Spectra J200 LIBS (https://www.appliedspectra.com/): A high-performance system designed for highly sensitive, accurate trace element analysis with detection limits in the single-digit ppm range across a wide variety of sample matrices. It supports both laboratory and production monitoring applications, offers flexible hardware configurations, and uses an Nd:YAG laser with tailored spectrometer options to deliver reliable, repeatable results for diverse analytical needs. Chemometric models assist with automated peak assignment and concentration prediction.
  • Malvern Panalytical Zetium XRF (https://www.malvernpanalytical.com/): High-resolution, high-sensitivity XRF for elemental and material characterization. Designed for high-quality, high-precision elemental analysis from sub-ppm to percentage levels across a wide range of applications, including process control, quality assurance, and R&D. It features flexible power upgrades, multiple X-ray tube anode options, and advanced detectors such as duplex and HiPer scintillation systems to enhance sensitivity, dynamic range, and analytical performance for both light and heavy elements.
  • Rigaku NEX QC II / II+ EDXRF (https://www.rigaku.com/): Compact, user-friendly analyzers with embedded PC/printer for routine QC of solids, liquids, powders, and films. The NEX QC II Series benchtop XRF analyzers are energy-dispersive XRF (EDXRF) systems that provide nondestructive elemental analysis from sodium (Na) to uranium (U) for industrial quality control, with fast, reliable performance and minimal operator training. They feature graphene-window SDD detectors (with enhanced performance in the QC II+ model), a compact fanless design with built-in touchscreen and printer, and support multiple sample types while minimizing maintenance and operating costs.
  • Shimadzu ALTRACE X-ray System: 65 kV tube, high count-rate detector, autosampler (48 samples), multifilter optimization for ppm to % analysis. Designed as a next-generation, nondestructive elemental analyzer capable of detecting trace to major elements from ppm to percent levels across solids, powders, and liquids using a high-energy 65 kV X-ray tube and high-count-rate detector. It features minimal sample preparation, automated calibration, and high-throughput capability (up to 48 samples), making it a fast, cost-effective solution for routine analysis and quality control.
  • XOS Petra MAX XRF (https://www.xos.com/):Portable, high-sensitivity elemental analysis with real-time AI-assisted spectral interpretation. Performs sulfur analysis (ASTM D4294) and measures up to 12 elements from phosphorus (P) to zinc (Zn), including trace elements like Ca, Fe, K, Ni, and V at sub-ppm levels using robust and precise EDXRF technology. Designed with a specialized sample introduction system to prevent contamination, along with an optional autosampler that improves workflow through automated sample handling, tracking, and support for QR-coded or standard XRF sample cups.

Remote/Stand-off Gas Analysis

  • Beamonics BeamSight (TDLAS) (https://beamonics.se/): True stand-off gas analyzer (up to ~100 m) for CH₄, CO₂, CO, HF, H₂S, and NH₃; compact version (≈15×11×8 cm, 0.7 kg); no retro-reflectors required; suitable for fence-line monitoring and mobile (drone/handheld) surveys. Uses proprietary TDLAS technology to provide true stand-off, alignment-free gas detection with high sensitivity across a wide concentration range (from background levels up to 100% volume) for gas analysis. It is calibration- and maintenance-free, resistant to sensor poisoning, and available in fixed or portable configurations with multiple interface options (USB, UART, I²C) for flexible integration.

Sample Preparation and Materials Characterization

Sample preparation remains critical for data quality and reproducibility. Many companies make incremental improvements on sample preparation equipment, and product updates should be reviewed by going to a specific company’s website.

  • LECO AMH6 Automated Hardness Testing System (https://www.leco.com/products/amh6/): Integrated optics and Cornerstone® software for streamlined characterization. Features automated load application and real-time analysis to deliver precise, repeatable, laboratory-grade hardness measurements in production environments. It is designed to improve efficiency and consistency by minimizing manual processes, supporting irregular or small specimens, and enabling reliable data management for regulated applications.
  • Pike Technologies MiniPlane II Sampling Knife (https://www.piketech.com/): Integrated magnifier, adjustable thickness, optional LED illumination for precision micro-sectioning. It is designed as a sample-preparation tool for thin-slicing multi-layered samples for transmission microanalysis, offering both carbide blades for polymers and diamond blades for samples containing metals. It features an adjustable knife edge to precisely control slice thickness for consistent and accurate sample preparation.
  • Milestone ultraWAVE 2 eco (SRC digestion) (https://www.milestonesrl.com/): Consistent digestion across matrices with improved sustainability and reproducibility. The Milestone ETHOS UP microwave digestion system and Milestone ultraWAVE SRC microwave digestion system provide advanced, high-performance sample preparation with complete digestion for atomic absorption (AA), ICP-OES, and ICP-MS analysis. They offer flexible, high-throughput operation with rugged rotor-based or single-reaction-chamber (SRC) technology, delivering superior digestion of challenging samples while maintaining efficiency, safety, and low operating costs.

Chemometrics, Software, Data Automation, and AI Integration

Modern spectroscopy applications increasingly rely on chemometrics and AI-driven software. Popular software vendors include:

  • ACD/Labs Spectrus Conduit (https://www.acdlabs.com/): Low-code/no-code automation for R&D workflows with native instrument data support (LC/MS, IR, NMR, Raman), enabling standardized, scalable dataflows for AI/ML.
  • Eigenvector Research, PLS_Toolbox (https://eigenvector.com): MATLAB integration, regression, and AI modeling with regular updates and feature additions.
  • Infometrix, Inc. (https://www.infometrix.com/): Offers chemometrics software updates, such as Pirouette 5.0, for multivariate data analysis and LineUp for data alignment, and its website is
  • MATLAB (MathWorks, https://www.mathworks.com): Open-source AI pipeline for spectral analysis
  • Python (https://www.python.org): Open-source AI pipeline for spectral analysis.
  • MountainsSpectral (https://www.digitalsurf.com/software-solutions/mountainsspectral-for-spectroscopy/): End-to-end spectral and hyperspectral processing, peak fitting, multivariate tools, and automated reporting.
  • SIMCA (Sartorius, https://www.sartorius.com): Principal component analysis (PCA), partial least squares (PLS), and classification models for regulated workflows.
  • Unscrambler X (CAMO Analytics, https://www.camo.com): Spectral preprocessing, multivariate calibration, and predictive modeling.
  • Wiley KnowItAll 2026 (https://www.wiley.com): AI-assisted spectral libraries for automated identification. Unified spectral identification and data management across 130+ formats with AI-assisted libraries.

These platforms now integrate AI-driven predictive analytics, cloud-based workflows, edge AI for on-instrument processing, and digital twinning for instrument calibration and maintenance management.

Table 1: Selected 2025–2026 new products and platforms

Conclusions

Spectroscopy from 2025 to 2026 demonstrates a clear shift toward intelligent, automated, and interconnected systems. This landscape shows a decisive shift toward intelligent, automated, and connected spectroscopy. Embedded AI, portable platforms, and integrated software ecosystems are enabling real-time, in-field decision-making and paving the way toward autonomous laboratories and digital twins.

  • AI and chemometrics are central to workflows
  • Portable, field-deployable instruments broaden analytical reach
  • Multimodal systems enhance analytical depth
  • Cloud-based instrument ecosystems enable real-time decision-making

Future trends include fully autonomous analytical laboratories, AI-driven digital twins, self-calibrating instruments with embedded predictive models, and seamless integration of spectral data into laboratory and process control systems. Continued development of quantum-enhanced detection, ultrafast lasers, and AI-assisted spectral analysis is expected to further advance analytical capabilities.

References
  1. Miseo, E. V. Review of Spectroscopic Instrumentation. Spectroscopy 2025, 40 (4), 26–31. DOI: 10.56530/spectroscopy.nx9188m9.
  2. Coca-Lopez, N.; Alcolea-Rodriguez, V.; Bañares, M. A.; Brockhauser, S.; Gorenflot, J.; Henderson, A.; Hildebrandt, R.; Jeliazkova, N.; Kochev, N.; Lozano Diz, E.; Pilat, Z. Artificial Intelligence-Powered Raman Spectroscopy through Open Science and FAIR Principles. ACS Nano 2025, 19 (44), 38189–38218. DOI: 10.1021/acsnano.5c09165.
  3. Evans, E. H.; Pisonero, J.; Smith, C. M.; Taylor, R. N. Atomic Spectrometry Update: Review of Advances in Atomic Spectrometry and Related Techniques. J. Anal. At. Spectrom. 2025, 40, 1136–1157. DOI: 10.1039/D5JA90013A.
  4. Ibrahim, A.; Kumar, G. A Framework for Integrating Lean Six Sigma and Industry 4.0 for Sustainable Manufacturing. Int. J. Prod. Res. 2025, 1–23. DOI: 10.1080/00207543.2025.2571202.
Further Reading
  1. Agilent Technologies. Analytical Instrumentation Portfolio. https://www.agilent.com.
  2. Bruker Corporation. FTIR and NMR Systems Overview. https://www.bruker.com.
  3. CAMO Analytics. The Unscrambler Software. https://www.camo.com.
  4. Eigenvector Research. PLS_Toolbox and Other Chemometrics Software. https://eigenvector.com.
  5. Infometrix, Inc. Chemometrics Software. https://www.infometrix.com.
  6. Malvern Panalytical. Materials Analysis Systems. https://www.malvernpanalytical.com.
  7. Sartorius. SIMCA Chemometrics Software. https://www.sartorius.com.
  8. Shimadzu Corporation. UV-Vis and Analytical Systems. https://www.shimadzu.com.
  9. Thermo Fisher Scientific. Product Documentation. https://www.thermofisher.com.
  10. Wiley. KnowItAll Spectral Database. https://www.wiley.com.