2013 Salary Survey: The Future is Bright
The results from Spectroscopy's annual salary survey examines working conditions and more.
If asked by a young scientist considering career options, would you recommend your career? Over half of respondents to this survey said they would. Here, our annual salary survey takes a look at the salaries and working conditions for spectroscopists to find out why.
For more than a decade, spectroscopists have been invited to take part in the annual Spectroscopy salary survey. Over this period there has been great change, and this year is no exception. With the global economy looking a little bleak to say the least, it is a pleasant surprise to find that the future looks a little brighter for spectroscopists. With salaries continuing to rise (see Table I), satisfaction levels are high, and generally the outlook is good.

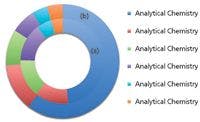

Figure 1: The six biggest specialty areas of respondents: (a) inside chart: number of respondents in each specialty area in 2012; (b) outside chart: number in 2013.
This year, the survey had a healthy number of respondents, a total of 471, with 89% completing all questions. As individuals have differing limits on the information that they are willing to share, the survey allowed for the skipping of questions. This choice was intended to reduce the risk of false results, and it resulted in differing numbers of responses for some questions. Within this article, data are presented as percentages to allow comparison between data. The profile of the respondents is shown in the breakdown below:
- Age of respondent: 18% <40 years; 30% 40–50 years; 31% 50–60 years; and 21% 60+ years.
- Gender: 25% female and 75% male.
- Employment status: 91% of spectroscopists are employed full time.
- Primary field of analysis: 49% analytical chemistry; 11% pharmaceuticals; 8% environmental; 6% instrument design and development; 4% organic chemicals; 4% biotechnology; 4% forensics or narcotics; 3% plastics, polymers, and rubber; 2% agriculture and food; 2% medical or biological; 2% petroleum or energy; 2% inorganic chemicals; 2% metallurgy, and less than 1% biotechnology. (Refer to Figure 2 for comparison between 2012 and 2013.)
- Area of employment: The biggest employment area is private industry, over half of respondents (53.23%).
- Education level: 42% doctoral degree; 24% master's degree; 31% bachelor's degree, and 4% associate degree.
Salaries
The average salary reported this year was $88,018, an increase of $2958 compared to last year's average. Table I lists the average salaries reported for 2002–2012. Looking at the split between the genders, the average salary for women has increased by 9% from 2012 to 2013 — from $71, 988 to $81,163 — whereas for men it has increased by 5% from 2012 to 2013 — from $88,468 to $93,081.

Table I: Average salaries 2002â2013
This year's level of overall increase is considerably higher than that of last year, indicating that the prospects for spectroscopists are improving.
Workload and Stress
With a bleak economy in many regions, it is no surprise that companies are cutting back on resources. One of the biggest expenses for any employer is staffing, and so the survey set out to address whether employees had experienced an increase in their workloads over the course of the past year, and if so, what the causes were. This year, 63% of respondents indicated that their workload had increased over the past year, compared to 59% in 2012; 3% reported a decrease, compared to 5% last year. The major reasons for increased workload were increased business (36%), staffing cuts (24%), new equipment (18%), and new regulations (16%). Other responses included the loss of staff without replacement, reduced funding, and increased employer regulations.
Yet it seems that an increase in workload does not always mean an increase in employee stress levels. If a spectroscopist is happy with her employer and has a good working relationship with her team, perhaps taking on extra work doesn't seem so onerous. So even though 63% of respondents reported an increased workload over last year, only 52% reported an increase in their stress levels. Nevertheless, the number reporting increased stress is up slightly from last year's number of 49%.
The Value of Education
Big decisions that shape one's career are made early on, when deciding on the subject and the level of education to pursue. Our survey results show a strong correlation between education level and average salary (refer to Figure 3), from an average salary of $64,196 for spectroscopists with an associate degree up to an average of $102,017 for those with doctorates. The percentage of those in management positions also goes up with each education level, reaching 50% for those with doctorates. In open-ended questions, a number of respondents also stated that PhD holders are more employable than bachelor's degree holders within the field of spectroscopy.

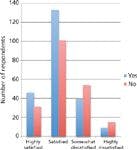

Figure 2: Satisfaction increases with the offering of training. Blue bars
But across the salary scale, spectroscopists are a very happy lot. Overall, 73% of respondents are either highly satisfied or satisfied with their employment, and 27% feel either dissatisfied or highly dissatisfied (refer to Figure 2) But what is curious is that this figure of 73% stating overall job satisfaction is much higher than the specific satisfaction levels with salary or nonmonetary recognition.

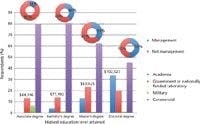
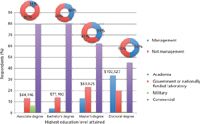
Figure 3: The value of education. The bar chart shows the relationship between education level and the type of employer. The pie charts show the
In terms of monetary recognition, 56% of respondents feel fairly rewarded, with those with bachelor's degrees expressing the highest degree of satisfaction, as follows:
- Bachelor's degree holders, 59%
- Doctoral degree holders, 57%
- Master's degree holders, 48%
- Associate degree holders, 43%
Asked if satisfied with their level of nonmonetary recognition, 57% of respondents said yes. The breakdown in order of satisfaction is as follows:
- Associate degree holders, 79%
- Master's degree holders, 59%
- Doctoral degree holders, 55%
- Bachelor's degree holders, 43%.
These responses were a little surprising, as it showed that increasing levels of education did not correlate with satisfaction with one's salary or recognition. Associate's-degree holders were the least satisfied with monetary recognition received, but were the most satisfied with their nonmonetary recognition. Bachelor's-degree holders were the most satisfied with their salaries, but the least pleased with their nonmonetary recognition. Doctoral- and master's-degree holders were in the middle in both cases.
Employer Investment
Feeling that you have the support of your employer is important. A simple way employers can improve the satisfaction of employees is to offer benefits. Of the respondents, 90% receive health care coverage through their jobs; 71% have a 401k; 60% have a retirement or pension plan; and 10% get child care benefits. Some respondents receive additional benefits, such as stock purchase plans, membership to fitness clubs, and life insurance; 5% of our respondents receive no benefits.
Another way employers can make employees feel valued is to invest in their career development. More than half of respondents, 53%, are offered training by their employers, with 55% gaining the benefit of training courses, 44% attending seminars, and 1% attending web seminars. To check the connection between employer-offered training and job satisfaction levels, we cross-tabulated those answers with satisfaction ratings of employees (Figure 2). For respondents offered training by their employers, 78% are either satisfied or highly satisfied. For respondents not offered training by their employer, 68% are either satisfied or highly satisfied. So it appears that the investment pays off.
However, this year's survey showed some cuts are being made in employee training. Some respondents suggested that the employment opportunities are excellent for spectroscopists who are highly skilled, but that their companies are reducing resources for training inexperienced employees.
The Gender Divide: A Year On
The inequality between the salaries of men and women has been well documented by previous salary surveys, and this year is no exception: The average salary for men in our survey was $93,081, compared to $81,163 for women. We did document, however, some key factors that probably affect those numbers (Figures 4 and 5).

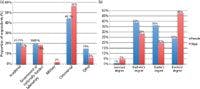
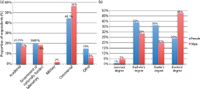
Figure 4: (a) Type of employer, by gender. (b) The education level of respondents, by gender.
These factors including type of employer (56% of men are employed by industry, the highest-paying employer type, compared to 44% of women), education level (48% of our male respondents have a doctorate, compared to 34% of female respondents), and the length of one's current employment (30% of men in our survey have been in their current employment for 30 years, compared to 21% of women who have been there that long).

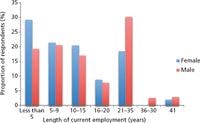

Figure 5: The length of time in current employment for male and female respondents.
As previously mentioned, the gender divide has existed for many years, and it has been documented by Spectroscopy. It will most likely take a period of years for the balance to be addressed because ultimately, education and experience level are fundamental to salary.
Ambitions of Spectroscopists in 2013
The times of staying in one job are disappearing, and it is now very common to change jobs several times during the course of a career. Several respondents commented that spectroscopists have good employment opportunities. Respondents also feel that the technology continues to advance and the use of analytical techniques is increasing, indicating good job prospects for the future. One respondent referred to analytical chemistry as a "growing piece in a giant puzzle."
This year, we once again asked respondents about their intentions to look for a new job. Just over a quarter of respondents, 26%, are planning to look for alternative employment within the next year — a 5% increase over 2012. The reasons given for making a move were
- Looking for a higher salary, 23%
- Dissatisfaction with employer, 20%
- Looking for a new challenge, 20%
- Greater responsibility, 13%
- Personal reasons, 8%
- Change in employer type, 6%
- Dissatisfied with workload, 6%
- Change in employment industry, 3%
- Decreased expectations in salary, 2%.
These responses indicated three main motivating factors: the desire for a higher salary (23%), the desire for a new challenge (20%), and dissatisfaction with one's employer (20%).
For some, however, even if highly dissatisfied, looking for new employment is not an option. We asked respondents who indicated that they would not look for a new job in spite of being unsatisfied to share why. The main reasons follow:
- Convenient location, 23%
- Lack of jobs in geographical area, 17%
- Good colleagues, 16%
- Good working hours, 16%
- Good salary, 10%
- Good management, 9%
- Competition for other jobs is high, 8%
- Other, including retirement, benefits, and consideration of partner's employment, 11%.
These responses indicated that a number of elements can keep one at a less than satisfying job, with location being a key factor.
Location, Location, Location: How Does Geography Affect Employment?
Geographical location has been shown to be very important; as indicated above, even employees dissatisfied with their current positions are willing to stick it out for convenience or because of a lack of jobs in their area (thus indicating an unwillingness to move, perhaps for personal for family reasons).

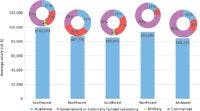
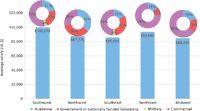
Figure 6: The importance of location to employment: The average salary for each region is shown in the bar chart. The employment industries in each area are shown in the pie charts; colors used are indicated in the legend. Regions denoted: Southwest (CA, HI, AZ, NM, NV, CO, UT, OK, TX); Northwest (OR, WA, ID, MT, WY, AK); Southeast (LA, MS, AL, GA, FL, TN, KY, NC, SC, AR, DE, VA, WV, MD, DC); Northeast (MA, CT, NY, NJ, PA, VT, NH, RI, ME); and Midwest (OH, IN, IL, IA, MO, MI, MN, WI, KS, ND, SD, NE).
Salaries, and type of employer, also vary quite a bit from one region of the United States to another (see Figure 6), as indicated below:
Southwest
The Southwest continues to be the place with the best-paid jobs. This region has an average annual income of $100,078, which is an increase on last year's average of $92,238 but similar to the average in 2011 of $101,023. This is true even though only 53% of respondents in this region work in industry, which is typically the highest-paying employer (Table II), but another 22% work in government or national laboratories, which also generally offer good pay for the top scientists.
Northeast
The Northeast falls in at second place with an average salary of $93,646, an increase on last year's average of $89,290. Here, 65% of respondents work in commercial industry.
Northwest
The Northwest is in third place with $87,777. This is an increase compared to last year's total of $80,879, with employment quite evenly distributed among academia, national laboratories, and industry.
Southeast
The Southeast lands in fourth place with an average of $85,667. This is a decrease from the 2012 total of $89,093. Commercial industry employs 49% of respondents, followed by 31% in academia, 16% in government or national laboratories, and 4% in the military.
Midwest:
The Midwest comes out in fifth place with an average annual salary of $84,890. This is an increase on the 2012 average of $78,851. Commercial industry employs 65% of respondents in this region, followed by 19% in academia and 16% in government or nationally funded laboratories.
Reviewing Career Choices
A new addition to this year's survey was a question about the best career advice respondents had ever been given. Responses ranged from "don't do it" to constructive advice such as "pursue an education before a career." A selection of responses is shown below:
- "Obtain the highest degree possible before entering the work force."
- "Find something you like to do and someone willing to pay you to do it, and never go to work a day in your life."
- "Keep your eyes open. The job you are in may not be where you would best be happy. You may feel happy now, but you never know how well you enjoy another job role until you have a chance to try it. If it interests you, go for it."
- "Stay off the managerial ladder."
Conclusion
Overall, spectroscopists are generally quite satisfied. A higher level of education does correlate to a higher salary in this field, but spectroscopists across the salary range express high levels of career contentment. And although cuts are being experienced and workloads are increasing, spectroscopists seem to accept this as an inevitable consequence of the current economic climate. As one respondent summarized, the spectroscopy market "is expanding for those who are career minded and not only in it for the pay."
Methodology
The staff of Spectroscopy designed the 2013 Spectroscopy Salary Survey and administered it using an on-line survey tool. A link for the on-line survey was successfully sent to 37,813 subscribers, and a total of 471 individuals responded. The field time for the survey was December 2012 through February 2013 (with three reminder e-mails sent out). To encourage participation, subscribers who responded to the survey were entered into a drawing to win a $100 gift card.


Newsletter
Get essential updates on the latest spectroscopy technologies, regulatory standards, and best practices—subscribe today to Spectroscopy.


Scientists Use Water and Light to Uncover Honey Adulteration
July 30th 2025In a 2025 study, Indian researchers demonstrated that combining near-infrared (NIR) spectroscopy with aquaphotomics enables rapid, non-destructive detection of adulterants in honey by analyzing changes in water’s spectral behavior. Using chemometric models, they accurately identified and quantified six common adulterants, offering a powerful tool for food authenticity and quality control.


Scientists Use AI and Spectroscopy to Detect Fake Honey in Bangladesh
July 29th 2025Researchers in Bangladesh have developed a rapid, non-destructive method to detect honey adulteration using UV-Vis-NIR spectroscopy paired with machine learning. Their findings could protect consumers and support food quality enforcement.


