Article
Spectroscopy
Spectroscopy
2015 Salary Survey: Modest Gains, but Not for Everyone
Author(s):
The latest Spectroscopy salary survey shows that the average salary has remained essentially static overall, which is welcome news after last year's drop. But not all sectors and groups are doing better.
(Image Credit: Steve Allen/Getty Images)
The latest Spectrosco


py salary survey shows that the average salary has remained essentially static overall, which is welcome news after last year's drop. But not all sectors and groups are doing better.
It can be hard to gauge whether or not your employment conditions are fair, and whether you are earning as much as you deserve - or as much as your colleagues do, be they down the hall or across the country.
The Spectroscopy salary survey helps answer those questions, and also provides an overall sense of the job market for spectroscopists. This year, the top-level result is fairly positive, but the benefits are not enjoyed by everyone. And a few details hint at some additional underlying concerns and trends.
Salaries Stable Overall, but Not for Everyone
This year, our survey results show overall stability in the spectroscopy job market, with a very slight increase (0.9%) in the average salary overall, from $81,990 in 2014 to $82,733 in 2015. Following last year's 7.3% drop (Table I), this year's small uptick is welcome news. The improvement, however, was not shared evenly across all segments and groups (Table II).


For example, even though the highest average salary is found in industry (58% of our sample), this year's average of $85,219 is down 6.4% from last year. In academia (26% of our sample), average salaries are also down - 6.9% lower than 2014. On the other hand, salaries for spectroscopists working at government or nationally funded laboratories (15% of our survey) went up 5.8%, but the average for this group ($79,741), is still a chunk lower than in industry.


We also see uneven results when we look at different age groups and education levels. As expected, respondents holding a PhD degree earn the highest average salary, but this group showed a disturbing drop in average salary between 2014 and 2015- from $97,936 to $88,724 (down 9.4%). This decrease may be partly explained by an increase in our sample of younger respondents (31% of our respondents this year are under 40, compared to only 20% last year) which likely includes many newly minted PhDs. But the idea that spectroscopists with more experience earn more did not hold true across all age groups. Respondents in the age range of 50–60 earned the highest salary, and showed a whopping 11% increase in average salary, from $86,003 to $95,161. But those over 60 saw a significant drop, from $100,117 to $90,209 (down 9.9%), putting their average below that of the 50–60 age group.


There is also a great deal of variation in the average salaries according to job role, as shown in Table IV. The best-paid job role is technical director (2.7% of respondents) with an average salary of $122,134. Laboratory directors and managers, who represent the largest proportion of respondents (17.5%) also do quite well, with an average salary of $87,006. The lowest-paid job role is post-doctoral researcher (2% of respondents) with an average salary of $32,005.


More Part-Time Workers and More Post-Docs
In addition to the fact that not all sectors and groups benefited from this year's average stabilization of salaries, a few other disturbing trends appear in our results (Table III). First, full-time employment has decreased over the past three years, from 92.8% in 2012 to 86.5% in 2015 (or from 94.7% to 88.9%, if we include full-time contractors). Second, in academia, the proportion of post-doctoral researchers and graduate students has increased from 0.3% in 2012 to 4.5% in 2015. Third, unemployment, although still low among our respondents, has tripled from 0.6% in 2012 to 1.9% in 2015. In addition, the gender gap among our respondents has widened and is discussed in further detail later.
Working Harder, Teaching More
The other negative trend seen in our survey - though by no means new, nor unique to spectroscopy - is increasing workloads. The majority of respondents (64%) reported that workloads have increased over the past year (Figure 1), mainly because of increased business, new equipment, or staffing cuts, or a combination of those factors. A handful said the main cause was "increased responsibilities," though it was unclear whether those new responsibilities included a promotion or a raise. Quite a few academics said they have to teach larger or more classes than in the past - in some cases because of administrative goals to make faculty "more productive" - and some mentioned that they are doing more research with the same funding, meaning they cannot afford to hire as many post-docs to share the workload.

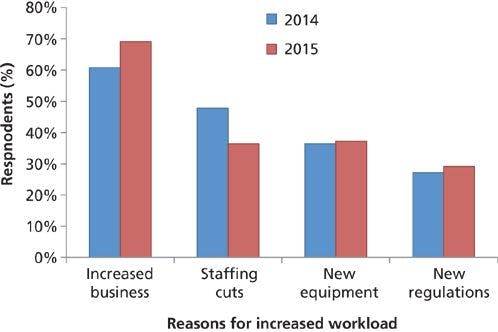
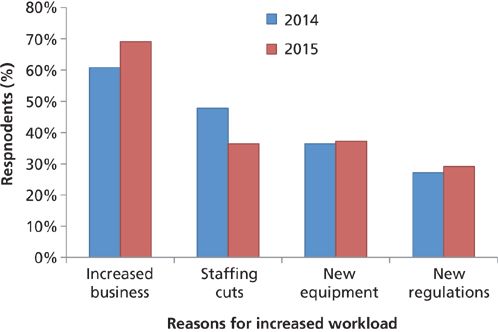
Figure 1: The most common reasons for increased workloads.
Satisfied, Nevertheless - Though a Bit Restless
Surprisingly, although 64% of respondents reported a heavier workload, only 53% said their stress levels had increased. And despite the increased workloads and the other concerns revealed by the survey, respondents remain happy overall. More than three-quarters of respondents report that they are either satisfied (58%) or very satisfied (18%) with their jobs.
Nevertheless, our data show that spectroscopists are changing jobs more than in the past, as is generally true across the economy. One-third of our respondents are planning to look for a new job over the next year. The drivers for this job seeking are a mix of dissatisfaction and ambition. Of those planning to look for a new job, 59% are seeking a higher salary, and 53% are looking for a new challenge. Several other reasons were given by those seeking new jobs:
- Dissatisfied with employer, 36%
- Personal reasons, 26%
- Looking for more responsibility, 24%
- Desire for a change in employer type, 21%
- Dissatisfied with workload, 14%
- Want to change industries, 12%
- Decreased expectations of salary, 4%.
On the flip side, some respondents are staying put despite job dissatisfaction. Common reasons included positive factors such as good colleagues, hours, and salary. A few mentioned negative reasons, such as fears of facing age discrimination if they try to find another job. A handful confessed that they are hanging in there until they retire.


Location, Location, Location
The location of a job is another key factor when deciding whether it is time to move on. Many of our respondents are staying in jobs they are not satisfied with because the location is convenient. And although these results suggest that many people would not readily make a big geographic move to improve their employment situation, there are some important regional variations in average salaries and job opportunities across and outside the United States, as seen below and in Table V.


In the United States, the Northeast (22% of respondents) has held its top salary position for the second year in a row, albeit with a dip in average salary from $106,318 in 2014 to $103,504 in 2015. The Southwest (16% of respondents) remains in second place for salaries, but the average in this region has decreased for several years, falling 8.5% in the last year, from $90,271 to $82,546.
The Northwest (5% of respondents) has risen to the third position, with an average salary reported of $79,027 - an 8% increase compared to 2014 ($73,510). The Southeast (18% of respondents) has fallen to fourth place, with a reported average salary of $77,381 (down from $82,175 in 2014). The Midwest (20% of respondents) is in last place, with an average salary of $77,193 in 2015 (up from $73,510 in 2014).
Outside the United States
A fifth of respondents (20%) were from locations outside the United States, primarily in Europe (Denmark, France, Germany, Spain, and the UK), Australia and New Zealand, China, India, Japan, and Mexico. The average salary of these respondents - $61,006 - is markedly lower than in the United States. Multiple factors are responsible for this disparity, including cost of living and the variations in how health care and other core services are provided.
The Gender Gap
There is still a persistent gap in the average salaries of men and women. This year, the average salary for male respondents is $83,199 (down 0.2% from 2014), compared to $74,584 for women (down 6%). In 2014, the difference in average salary for men and women was $3995; this has more than doubled, to $8615.


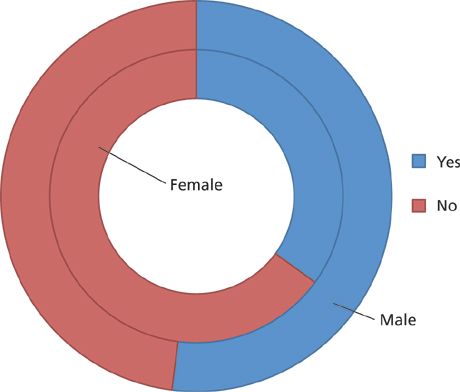
Figure 2: Respondents in positions of management. Inside circle: Female respondents. Outside circle: Male respondents.
Male Managers Earn More
Men also continue to dominate management, with more than half of male respondents (52%) in a position of management compared to only 35% of female respondents (Figure 2). And male managers make more than female managers - $86,616 for men versus $76,926 for women (Table VI).


A PhD Pays Off Better for Men
Figure 3 shows that 40% of male respondents hold a PhD compared to 34% of female respondents; however, male respondents with a PhD have an average salary of $94,108 compared to $75,652 for female PhD holders (Table VI). A higher level of education doesn't seem to have the same impact for women as it does for men.

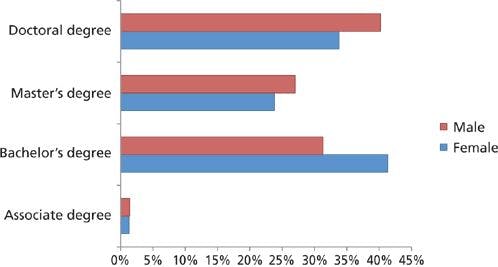

Figure 3: Highest education level attained according to gender.
Industry is Best for Women
The biggest pay gap between the sexes is seen in academia, where the average salary is $67,918 for men and $50,428 for women. In government and nationally funded laboratories, average salaries are $84,694 and $76,926, respectively. Industry is the one sector where the average salary for women ($89,172) exceeds that of men ($85,877).
Career Advice
Despite the only very modest increase in average salary overall, the salary drops for many groups, and the uncertainty of the employment market, half of respondents would recommend their career to a recent graduate, and only 10% would not. Interestingly, however, 40% of our participants responded "maybe" to this question. Given the high levels of job satisfaction expressed by our respondents, this ambivalence about recommending this path to young people may reflect concerns about the future of spectroscopy careers.
We also asked respondents for the best career advice that they had received. Many common and expected themes emerged, such as "work hard," "be honest," and "love what you do." A selection of other responses appears in a box on below.


Conclusions
This year's survey shows a modest overall improvement in average salaries, but in many sectors and groups, the averages actually went down. In addition, the percentage of full-time workers decreased, workloads went up, and the pay gap between men and women widened.
Yet in spite of it all, job satisfaction levels among spectroscopists remain high, perhaps reflecting a repeating refrain in the career advice shared by our respondents: "Love what you do."
Bethany Degg is an Associate Editor, based in Chester, UK. Direct correspondence to bdegg@advanstar.com


Newsletter
Get essential updates on the latest spectroscopy technologies, regulatory standards, and best practices—subscribe today to Spectroscopy.