Avoiding Misunderstanding Self-Absorption in Laser-Induced Breakdown Spectroscopy (LIBS) Analysis
In a recent article published in this journal (1), I discussed seven common errors that may affect the results of laser-induced breakdown spectroscopy (LIBS) analysis. Among these errors, one of the recurring ones is related to misunderstanding the process of self-absorption in LIBS plasmas. Because many people working in LIBS still consider self-absorption as a problem yet to be solved, I am dedicating a full article to this topic. The physics and chemistry of the phenomenon have been well known for many years, and this knowledge can tell us how self-absorption can be not only “corrected,” but also tuned to our advantage in analytical applications of LIBS.
Self-absorption occurs in spectrochemistry when part of the radiation emitted by an extended source is re-absorbed before exiting the source and eventually reaching the detector. In LIBS quantitative analysis, the measurement of the radiation intensity determines the number concentration of the emitting analyte. When the effects of self-absorption are negligible, a linear relationship is typically obtained between the measured intensity and the analyte number concentration. Dealing with linear relations makes life easier for the analyst because it allows for the building of (linear) calibration curves from which limits of detection (LOD) and limits of quantification (LOQ) of the analyte being studied can be determined.
In most spectro-analytical techniques, self-absorption effects can be considered negligible; however, in LIBS analysis, we often make measurements involving large concentrations of the analyte (percent level). In this case, the probability for a photon emitted by an atom or ion in the plasma to be reabsorbed by another atom or ion before exiting the plasma could be quite high, and definitely higher than that for the same analyte diluted at sub-ppm concentration in, for example, inductively coupled plasma–optical emission spectroscopy (ICP-OES) analysis.
The result of a strong self-absorption in LIBS is a nonlinear saturation effect, which is observed in the calibration curve; when the number concentration of the analyte increases, the measured intensity of the emission line does not grow proportionally. At large concentrations, the calibration curve saturates; it is well-known in the literature that in a log–log scale, the slope of the calibration curve changes from 1 to 1⁄2 with the increase of the analyte concentration and the effect of self-absorption.
Don’t Mistake Self-Reversal for Self-Absorption
Two observations should be made at this point, both correlated to frequent analytical errors. The first error that is often made in dealing with self-absorption in plasmas is mistaking this effect with the self-reversal phenomenon. Self-reversal manifests as a narrow dip on top of the emission line. Its presence is related to self-absorption, but self-reversal shows up only in the presence of spatial gradients of the plasma temperature and electron number density, which usually occur at the periphery of the plasma. Therefore, although the presence of self-reversal is an indication that the self-absorption phenomena in the emitting source are not negligible, as well as the spatial inhomogeneities in the plasma, its absence does not mean that self-absorption can be considered negligible.
Understand What Is Really Happening in a “Correction”
The second error that is, in my opinion, more subtle and substantial is associated to the need that some people working in LIBS feel to “correct” the effects of self-absorption. Although the term “correction” can be used at a colloquial level, it is nevertheless important to know that this term does not correspond to the true nature of the phenomenon.
An emitting source is also an absorbing source. There is no problem to be solved unless we insist on using an unrealistic treatment of the emission process in which each emitter is considered independent from the others. Instead, what we could do is take into account the physical processes occurring during the propagation of the radiation in the plasma (spontaneous emission, absorption, and stimulated emission, with the latter being in general negligible). In the approximation of homogeneous plasma in local thermal equilibrium, the number of photons emitted by the laser-induced plasma at a given wavelength along the line of sight of the detector can be easily determined by solving a simple differential equation:

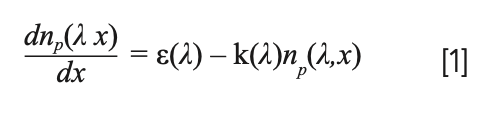

In the above equation, the ε coefficient is proportional to the number of emitters and to the spontaneous emission coefficient Aki of the transition (see Figure 1). Following the Einstein treatment of the propagation of radiation in a two-level atomic system (the same which is used to model the laser effect), it’s easy to demonstrate that the absorption coefficient, k, and the emission coefficient, ε, are linked by the relation:


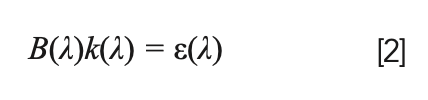
where B(λ) is the Planck black body radiation function at the plasma temperature (T). The radiation propagation equation can be easily solved, at each wavelength, along the line of sight of the detector.


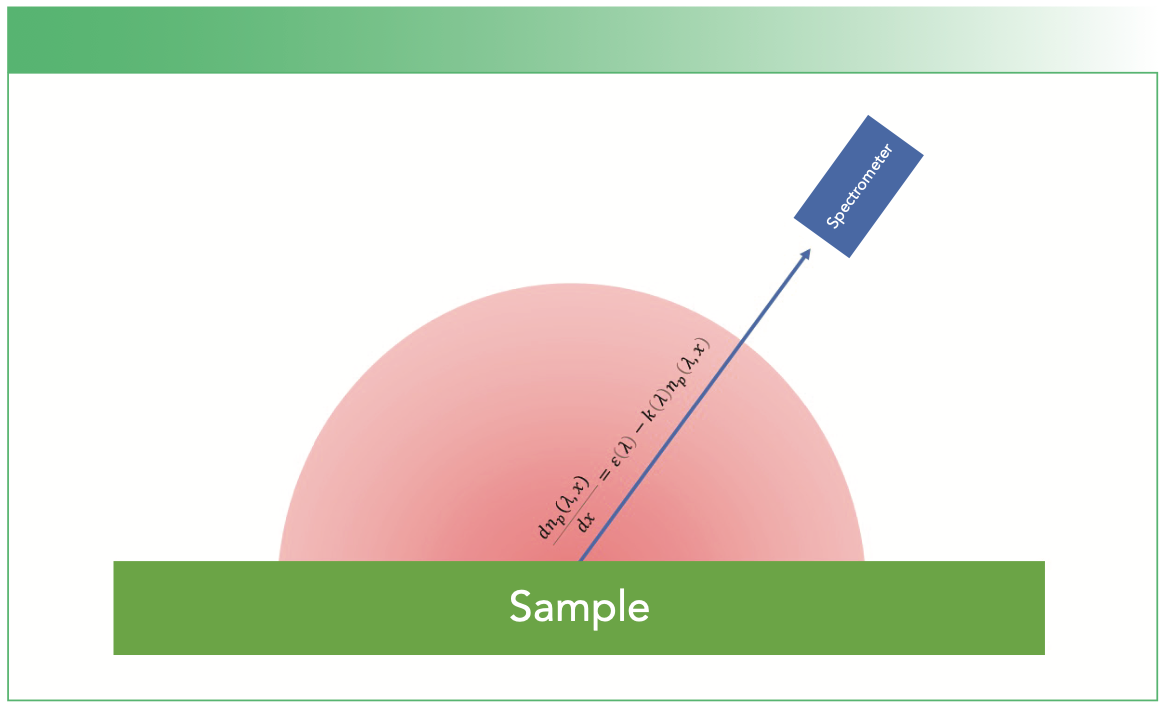
FIGURE 1: Schematic representation of the phenomena occurring within an emitting plasma.
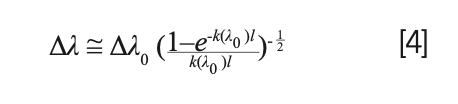
The shape of the lines emitted by an optically thin plasma (k(λ)l <<1) is usu- ally well approximated by a Lorentzian function, peaked at the wavelength of the transition. However, because the absorption coefficient is proportional to the emission coefficient, the effect of self-absorption is more evident where the emission is stronger (at the peak of the line). This deformation of the shape of the emission lines makes the calculation of their integral intensity slightly more complex, but it can be demonstrated that, at least for low to moderate self-absorption, the integral intensity of the line would be given by:

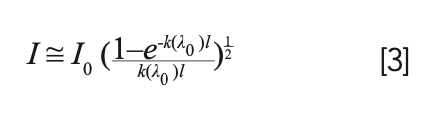

where k(λ0) is the absorption coefficient calculated at the peak of the emission line, and I0 is the integrated intensity (total number of photons emitted) that would have been measured on the detector if the plasma was optically thin.
It can also be demonstrated that the full width at half maximum (FWHM) of the self-absorbed line will increase with respect to the corresponding FWHM in optically thin plasma conditions following the same square root behavior:


Therefore, if we can estimate the FWHM of the line in the optically thin limit, it would be possible, by measuring the FWHM of the self-absorbed line, to estimate the value of the factor:


Substituting it in the relation for the line intensity, the simple relation is obtained:


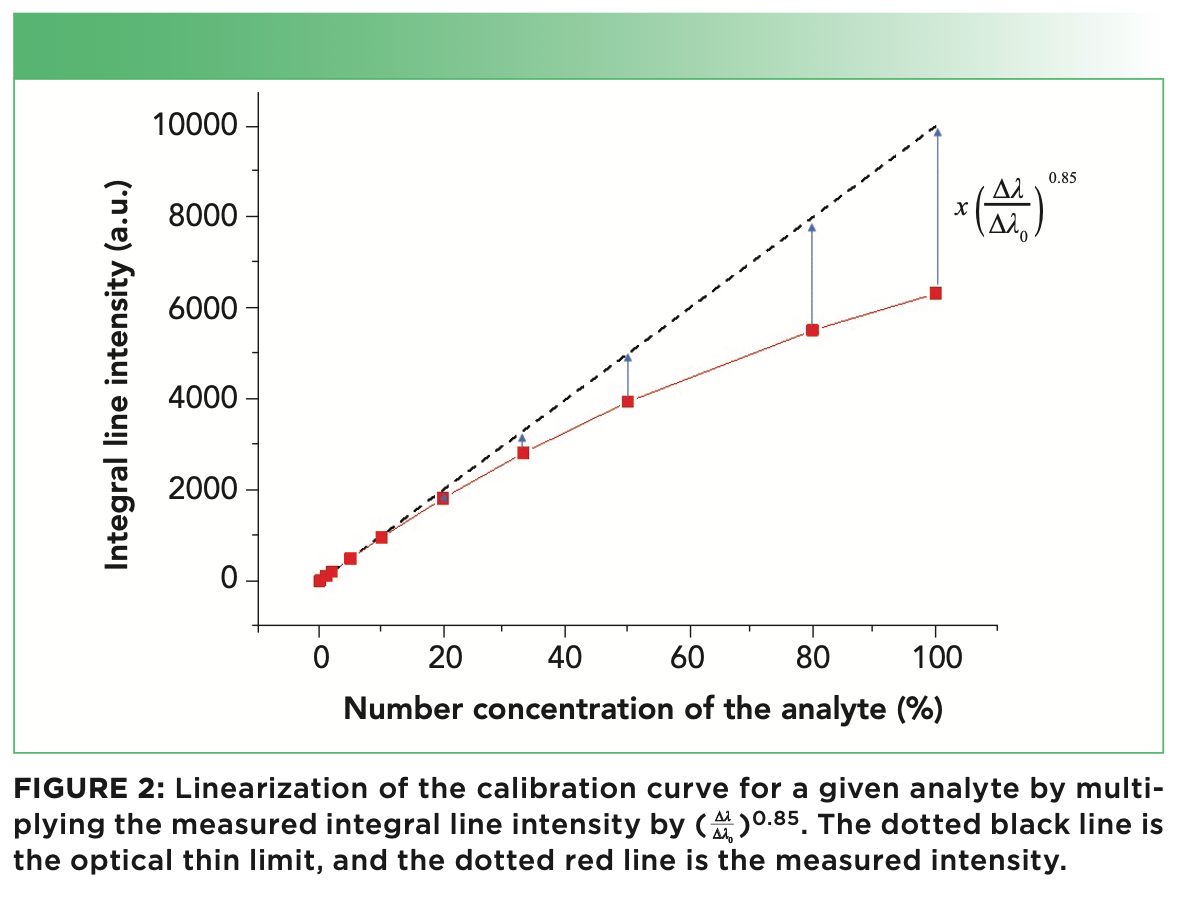
A more precise calculation leads to the formula I0 = I(Δλ/Δλ0)0.85, which is valid also in case of strong self-absorption. I0 is, by definition, proportional to the number of emitting atoms or ions in the plasma; therefore, the above equation allows recovering a linear relation between the measured intensity, I, and the concentration of the analyte (see Figure 2).


Conclusions
In conclusion, we can safely say that the self-absorption effect in LIBS is not a problem anymore. On the contrary, the simple treatment of the plasma as a homogeneous emitter at a temperature T makes it possible to recover the linear dependence between signal intensity and number concentration of the analyte, which characterizes an optically thin plasma. Moreover, knowledge of the physics of the phenomenon contributes to improving the precision of the determination of fundamental plasma parameters as transition probabilities and Stark coefficients of non-optically thin emission lines (2). The numerical simulation of the radiation propagation equation has also demonstrated that the approximation of homogeneous plasma is not critical for the determination of the Stark coefficients of self-absorbed LIBS emission lines (3).
References
(1) V. Palleschi, Spectroscopy 34(8), 16–17 (2019).
(2) S.M. Aberkane, A. Safi, A. Botto, B. Campanella, S. Legnaioli, F. Poggialini, S. Raneri, F. Rezaei, and V. Palleschi. Appl. Sci. 10(14), 4973 (2020). https://doi.org/10.3390/app10144973
(3) V. Palleschi, J. Quant. Spectrosc. Radiat. Transf. 271, 107714 (2021). https://doi.org/10.1016/j.jqsrt.2021.107714
Vincenzo Palleschi is a Senior Researcher at the National Research Council of Italy in Rome, Italy, and a professor with Pisa University in Pisa, Italy. Direct correspondence to: vincenzo.palleschi@cnr.it ●


 Bonds")


Newsletter
Get essential updates on the latest spectroscopy technologies, regulatory standards, and best practices—subscribe today to Spectroscopy.


Laser Ablation Molecular Isotopic Spectrometry: A New Dimension of LIBS
July 5th 2012Part of a new podcast series presented in collaboration with the Federation of Analytical Chemistry and Spectroscopy Societies (FACSS), in connection with SciX 2012 — the Great Scientific Exchange, the North American conference (39th Annual) of FACSS.


Developing Sensitive Optical Methods for Early Disease Detection
May 5th 2025Noureddine Melikechi, dean of the Kennedy College of Sciences and professor at the University of Massachusetts Lowell, shares his work on the early detection of diseases like epithelial ovarian cancer and Alzheimer’s.
. Photo Credit: © Kelsey Williams.")

