Article
Spectroscopy
Spectroscopy
The C=O Bond, Part III: Carboxylic Acids
Author(s):
How to spot carboxylic acids in your IR spectra
We continue our survey of the infrared (IR) spectroscopy of the carbonyl bond with a look at carboxylic acids. These molecules have C=O, C-O, and O-H bonds, giving them a number of diagnostically useful group wavenumbers and making this functional group easy to spot. We also see how the spectra of saturated and aromatic carboxylic acids differ from each other. In the "IR Spectral Interpretation Review" sidebar, we look at how the strength of intermolecular interactions affect IR peak widths, which is germane to carboxylic acids because they engage strongly in hydrogen bonding.
This is the third installment in our examination of the infrared (IR) spectroscopy of the carbonyl or C=O bond, yet we have barely scratched the surface of this versatile functional group. So, you can look forward to several more articles on this ubiquitous and important chemical bond. In this column, we examine the spectra of carboxylic acids. Future installments will focus on carboxylic acid derivatives such as carboxylates, acid anhydrides, and esters.

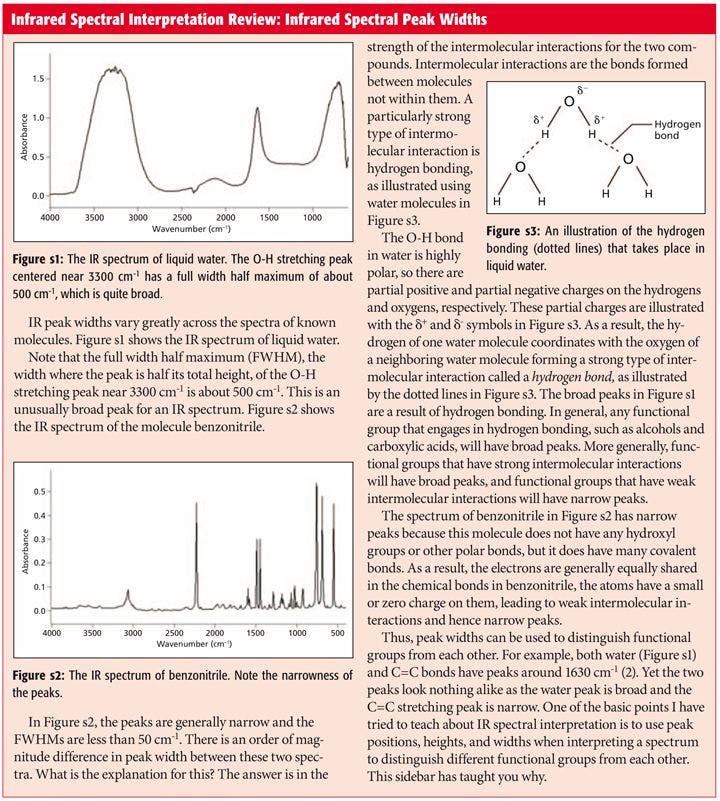

Infrared Spectral Interpretation Review: Infrared Spectral Peak Widths
The Carboxylic Acid Functional Group
The carboxylic acid functional group contains a carbonyl bond flanked by a carbon, called the alpha carbon, and an -OH or hydroxyl group as shown in Figure 1.

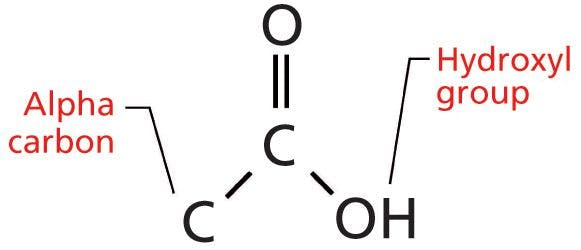
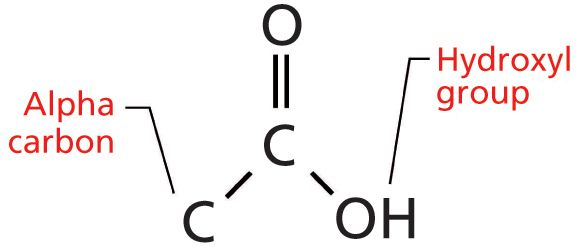
Figure 1: The structural framework of the carboxylic acid functional group. Note the locations of the alpha carbon and the hydroxyl group.
If the alpha carbon is saturated, the carboxylic acid is said to be saturated. If the alpha carbon is part of an aromatic ring, then we have an aromatic acid.
Carboxylic acids are considered acids because in aqueous solution they can ionize to give a proton and a negatively charged carboxylate (CO2-) ion. However, they are weak acids, easily illustrated by the fact that a carboxylic acid, called acetic acid, is found in vinegar and we eat it regularly, whereas if would be deadly to eat the much stronger mineral acids such as sulfuric, hydrochloric, or nitric.
In the first installment of this column published in January 2015 (1), I discussed that the one characteristic that determines peak widths in IR spectra is the strength of intermolecular bonding. Briefly, weak intermolecular interactions give narrow peaks while strong intermolecular interactions give broad peaks. This is explained further in the "Infrared Spectral Interpretation Review" sidebar. Any functional group that contains a hydroxyl or -OH bond will generally engage in strong hydrogen bonding. Carboxylic acids are no exception to this. In fact, the hydrogen bonding in these molecules is so strong that the solid and liquid states of carboxylic acid are not found as individual molecules but are bound up in what are called carboxylic acid dimers (or two parts) as shown in Figure 2.

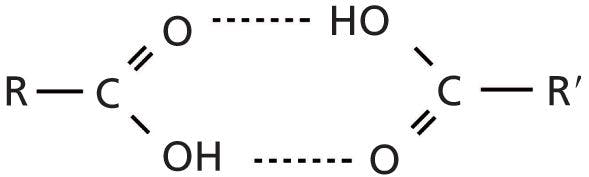

Figure 2: An example of a carboxylic acid dimer, a result of the strong hydrogen bonding that takes place in the solid and liquid forms of these molecules.
IR Spectra of Saturated and Aromatic Carboxylic Acids
Thus, when the IR spectra of solid and liquid carboxylic acids are measured it is the spectrum of the dimer that is actually seen. Not surprisingly then, the IR peaks of carboxylic acids are unusually broad as shown in the spectrum of 2-methyl butyric acid in Figure 3.

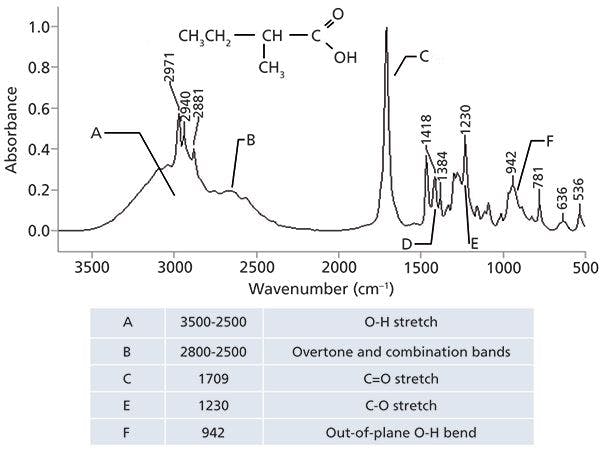

Figure 3: The IR spectrum of 2-methylbutyric acid, C5H10O2 (mix of d- and l-isomers).
The O-H stretch, labeled A in Figure 3, is so broad that there isn't really a peak position for it, just a range in which this wide envelope falls, from 3500 to 2500 cm-1 (going forward all peak positions quoted will be in cm-1). Note that the C-H stretches from the methyl and methylene groups in this molecule are narrow peaks that fall on top of the much broader O-H stretching envelope. It's not unusual in IR spectra for narrow peaks to show up on top of or as a shoulder on broader peaks when both happen to fall in the same wavenumber range such as this. This spectral region is another example of how peak widths can be used to distinguish functional groups from each other, with the nonpolar C-H bond stretches being much narrower than the polar O-H stretch.
In my experience, spectral regions like the one around 3000 in Figure 3 can be tricky to interpret. As trained spectral interpreters our eyes tend to look for C-H stretching peaks because they are so common, and in Figure 3 these peaks are clearly visible. What is tricky is that by focusing on these narrow peaks you may miss that they are riding on a broad spectral envelope and that there is an O-H bond present. I point this out because it's a mistake I have made myself.
Note in Figure 3 that there are some wiggles and bumps on the low wavenumber side of the OH stretching peak from around 2800 to 2500, which are labeled B. These features are common in the spectra of carboxylic acids, and are caused by overtone and combination bands. As discussed last time (5) these features are generally weak; however, recall that peak intensity in IR spectra is related to dµ/dx, the dipole moment change with respect to bond length during a vibration (1). For highly polar molecules, such as carboxylic acids, dµ/dx for the fundamental bands is large, and it is relatively large for overtone and combination bands, hence the intensity of the peaks from 2800 to 2500.


Quiz Section: Answer to the November Quiz and a New Interpretation Challenge
Like alcohols (3), which have an OH stretching and wagging peak, carboxylic acids also have an O-H wagging peak. In Figure 3 it is at 942, labeled F, and is generally found from 960 to 900. Note how broad this peak is because of hydrogen bonding. There are very few other functional groups that have broad peaks around 900, making this peak diagnostically useful.
Besides OH stretching and bending peaks, carboxylic acids of course have a carbonyl stretch. In Figure 3 it is seen at 1709, and in general for saturated carboxylic acids this peak falls from 1730 to 1700. Note that the C=O stretches of saturated ketones and aldehydes also fall in this range. Thus, as has been pointed out before (4), the position of carbonyl stretches by themselves is not enough to identify specific C=O containing functional groups, other peaks will be needed. In the case of carboxylic acids, it is the combination of a broad -OH stretch and a C=O stretching peak that gives us a diagnostically useful pattern. Other molecules, such as water and alcohols, have broad OH stretching peaks but no C=O peak. Many functional groups have C=O bonds, but most of them do not have OH stretching peaks, which is why this diagnostic pattern is useful.
A close look at Figure 1 shows that carboxylic acids also have a C-O bond. We know from previous experience (4) that C-O stretching peaks generally fall from 1300 to 1000. Carboxylic acids are no exception to this general rule. The C-O stretching peak in Figure 3 falls at 1230 and is labeled E. In general, for carboxylic acids this peak appears between 1320 and 1210. Carboxylic acids are unusual in that they give so many intense diagnostically useful peaks. Specifically, the OH stretch, C=O stretch, C-O stretch, and OH wag.
The IR spectrum of an aromatic carboxylic acid, benzoic acid, is seen in Figure 4.

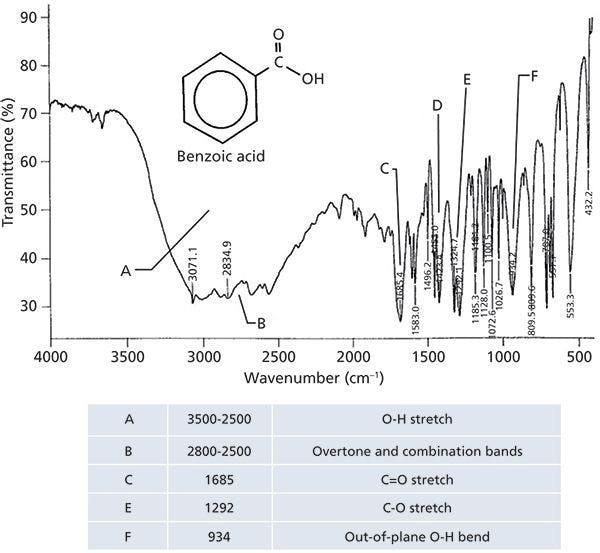

Figure 4: The IR spectrum of benzoic acid, C7H6O2.
I will be the first to admit that this spectrum is scary-it contains many intense peaks and on the surface appears difficult to interpret. This problem arises because as we study molecules with more and more functional groups in them their spectra will get more complex. Also, the highly polar nature of the carboxylic acid groups causes many peaks to appear with more intensity than they would in a less polar molecule because of large values of dµ/dx. However, using the 12-step process already taught to you on how to systematically interpret a spectrum (6), the analysis of Figure 4 can be tackled.
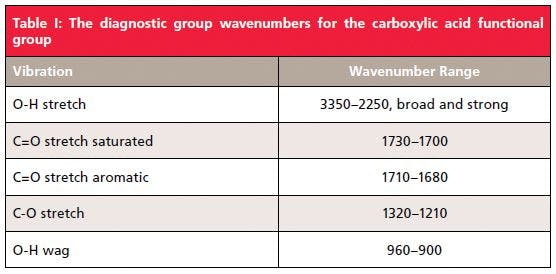
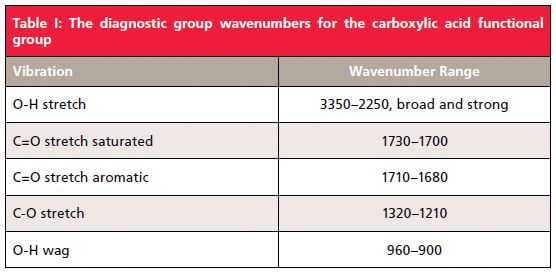
The first thing that should stand out in Figure 4 is the broad envelope labeled A that extends from 3500 to 2000; it makes up almost half the spectrum and is one of the broadest IR peaks you will ever see! This is of course the OH stretch of the carboxylic acid functional group. The C-H stretching peak of the aromatic ring is a sharp shoulder at 3071. As in Figure 3, there are overtone and combination bands in the 2800 to 2500 neighborhood labeled B in Figure 4. The C=O stretch of benzoic acid is at 1685, and in general for aromatic carboxylic acids this peak falls from 1710 to 1680, lower than for saturated acids, because of conjugation (3). The C-O stretch of benzoic acid is at 1292, and the O-H wag at 934, which is in line with the peak positions quoted above. Note that the only peak position here sensitive to whether a carboxylic acid is saturated or aromatic is the C=O stretch. The diagnostic group wavenumbers for all carboxylic acids are listed in Table I.

Conclusion
We have seen that carboxylic acids have broad OH stretching and bending peaks because of hydrogen bonding. The OH stretch is a broad envelope from 3500 to 2500, while the OH wag falls from 960 to 900. The carbonyl stretch for carboxylic acids falls from 1730 to 1700 for saturated acids and 1710 to 1680 for aromatic acids because of conjugation. The C-O stretch of these molecules is found between 1320 and 1210. The diagnostically useful pattern worth remembering to detect a carboxylic acid in a spectrum is a broad OH stretch combined with a C=O stretch. The broad OH wag around 900 is also unique and diagnostically useful.
References
(1) B.C. Smith, Spectroscopy 30(1), 16–23 (2015).
(2) B.C. Smith, Spectroscopy 31(11), 28–34 (2016).
(3) B.C. Smith, Spectroscopy 32(9), 31–36 (2017).
(4) B.C. Smith, Spectroscopy 32(1), 14–21 (2017).
(5) B.C. Smith, Spectroscopy 32(11), 28–34 (2017).
(6) B.C. Smith, Spectroscopy 31(1), 14–21 (2016).
(7) B.C. Smith, Spectroscopy 31(3), 34–37 (2016)
(8) B.C. Smith, Infrared Spectral Interpretation: A Systematic Approach (CRC Press, Boca Raton, Florida, 1999).
(9) B.C. Smith, Spectroscopy 30(4), 18–23 (2015).
(10) B.C. Smith, Spectroscopy 31(5), 36–39 (2016).


Brian C. Smith, PhD

Brian C. Smith, PhD, has more than three decades of experience as an infrared spectroscopist. He has published numerous peer reviewed papers and has written three books on the subject: Fundamentals of FTIR and Infrared Spectral Interpretation, both published by CRC Press, and Quantitative Spectroscopy: Theory and Practice published by Elsevier. As a spectroscopic trainer, he has helped thousands of people around the world improve their infrared analyses. He earned his PhD in physical chemistry from Dartmouth College. He can be reached at: SpectroscopyEdit@UBM.com


Newsletter
Get essential updates on the latest spectroscopy technologies, regulatory standards, and best practices—subscribe today to Spectroscopy.


