Article
Spectroscopy
Spectroscopy
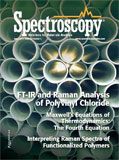
Discrimination of Carbonate-Containing and Carbonate-Free Polyvinyl Chloride with Fourier Transform Infrared Microscopy and Raman Spectroscopy
Author(s):
A method is presented using IR and Raman microscopy to discriminate carbonate-containing and carbonate-free PVC that helps forensic scientists trace suspects, avoid wrong certificates of authenticity, and characterize and analyze carbonate components.
Carbonate-containing and carbonate-free polyvinyl chloride (PVC) are polymers widely used in daily life. Many parts of bicycles and automotives are made of different kinds of PVC and they may be important trace evidence, especially in hit-and-run cases. The analysis of different PVC types is important to forensic scientists. In this study, we used a Fourier transform infrared (IR) microscope and confocal Raman spectroscopy to investigate these polymers. IR and Raman spectra were tentatively interpreted. The results indicated that IR and Raman microscopes are both effective tools to identify PVC and carbonate. Raman spectroscopy was found to be particularly sensitive to a low amount of carbonate in PVC that can be very difficult to identify using IR. The data help forensic scientists to trace suspects and avoid wrong certificates of authenticity. It also offers PVC producers and researchers an effective and fast method to characterize and analyze the carbonate components in PVC products.
Polyvinyl chloride (PVC, Figure 1), as a kind of inexpensive plastic, has become completely pervasive in modern society. It is the third most widely produced plastic, after polyethylene and polypropylene. The list of products made from PVC is exhaustive in daily life, ranging from drainage and potable piping to cards, cling film, toys, and water bottles. It is expected that PVC production will exceed 40 million tons by 2016. PVC can be used in many other ways, including window frames, doors, wallpaper, flooring, furniture, binders, pens, and pressure-sensitive tapes. Even many of the accessories for bicycles and automotives are products of PVC, such as pedals, covers for gear handles, and bumpers. Because these accessories are often found at hit-and-run scenes, it is important for forensic scientists to characterize these PVC products to trace the suspect vehicles.


Figure 1: Chemical structure and synthesis of PVC.
Carbonates are usually added into PVC to improve mechanical properties (tensile strength and elongation), thermal stability, and electrical properties. Calcium carbonate (CaCO3) is an important carbonate additive and its three mineral polymorphs are aragonite, calcite, and vaterite (1). Infrared (IR) spectroscopy, scanning electron microscopy–energy dispersive spectrometer (SEM-EDS), and thermogravimetric analysis (TGA) were used to discriminate carbonate-containing and carbonate-free PVC (2–14). It is easy to discriminate both forms of PVC by IR when carbonate content is high. However, when carbonate content is low, the IR spectrum is not available because many indicative peaks of carbonate are similar to those of PVC and may be overlapped by the latter. The interoperation of the IR spectrum is not detailed enough yet. SEM-EDS can provide information about the metal element content, but it cannot tell whether the metal is from carbonates or other mineral compounds (such as clay, kaolin, or bentonite) on the surface or in the interior of PVC. TGA also can be used to discriminate the two polymers, but it requires a larger sample amount than the spectroscopy approaches and destroys the samples in the analysis.
In this study, we used Fourier transform infrared (FT-IR) microscopy and Raman microscopy to investigate carbonate-containing and carbonate-free PVC. IR and Raman spectra were collected and tentatively interpreted. The indicative peaks to distinguish the two PVC in IR and Raman spectra are summarized. Considering that dioctyl phthalate (DOP) is often added into PVC products, we also used the IR and Raman microscopes to discriminate PVC containing DOP and PVC containing both DOP and CaCO3. During the analysis, fewer samples were needed and high-quality spectra and good discrimination could be obtained in only a few seconds. The method proved to be fast, accurate, and effective. To the best of our knowledge, there have been few studies to discriminate carbonate-containing and carbonate-free PVC using FT-IR and confocal Raman microscopy.
Materials and Methods
PVC, PVC containing CaCO3, PVC containing DOP, and PVC containing DOP, CaCO3, and other carbonate samples were provided by the National Technical Committee on Plastic Products of Standardization Administration of China. A PerkinElmer Spectrum GX 2000 system with a diamond anvil cell, a deuterated triglycine sulfate (DTGS) detector, and Spectra 5.01 workstation software were used to collect the IR spectra. The background was subtracted for every measurement and triplicate tests were performed at different sites for each sample.

Figure 2: IR spectrum of (a) CaCO3, (b) PVC, and (c) PVC with CaCO3.
A Renishaw inVia confocal Raman microscope system with two lasers emitting at 532 nm and 633 nm, respectively, and a charge-coupled device (CCD) detector was used to collect the Raman spectrum. The 532-nm laser was chosen for emission at 10–100% power, depending on the robustness of the samples. Crystal silicon with a fixed peak position (520 cm-1) was used to calibrate the Raman shifts before measurement. The spectra were collected using WIRE 3.0 workstation software in extensive mode ranging from 100 cm-1 to 3200 cm-1. Each spectrum was obtained by 3–10 accumulations to enhance the signal-to-noise ratio. Multiple measurements (n = 3) were made in different regions of the same sample to avoid variation.


Table I: Assignment of peaks for CaCO3
Results and Discussion
IR Spectrum
Figure 2 shows the IR spectra of CaCO3(Figure 2a), CaCO3-free PVC (Figure 2b), and CaCO3-containing PVC (Figure 2c). The main peaks in the IR spectrum of CaCO3 were detected at 2513, 1796, 1418, 876, 848, and 713 cm-1. This clearly indicates that peaks in the bands of 2400–2550 cm-1, 1700–1800 cm-1, 1400–1500 cm-1, 850–880 cm-1, and 690–740 cm-1 were the characteristic absorptions of CaCO3. The peak assignments for CaCO3 are listed in Table I. The CO3stretching mode at 1080 cm-1 was Raman active, but not IR active and thus was not included in Figure 2. The peak assignments for CaCO3-free PVC are listed in Table II. Figures 2b and 2c show that the main peaks of CaCO3-free PVC and CaCO3-containing PVC were both detected in the region of 2800–2900 cm-1 and at 1430, 1330, 1250, 1200, 1096, 970, 850, 700, and 615 cm-1. The CaCO3 indicative peaks of strong intensity at 1430, 850, and 710 cm-1 were all overlapped by the wide and intensive absorption peaks of PVC at 1430, 848, and 689 cm-1. Only the weak indicative peaks at 2513 cm-1 and 1796 cm-1 can be used to identify CaCO3. As shown in Figure 2c, peaks at 2513 cm-1 and 1796 cm-1 were very weak and hard to integrate. If the CaCO3 content is low, then it is difficult to discriminate CaCO3-free PVC and CaCO3-containing PVC by IR.


Table II: Assignment of peaks for PVC
DOP is often added into PVC in many products, so we offer an example using IR to discriminate PVC containing DOP and PVC containing both DOP and CaCO3. Figure 3 shows the IR spectra of PVC containing CaCO3 and DOP (Figure 3a) and PVC containing DOP (Figure 3b). In Figure 3a, absorption peaks at 2517, 1794, 1400, 873, and 711 cm-1 were indicative peaks of CaCO3; peaks at 2960, 2927, 2873, 1400, 1287, 967, 711, and 615 cm-1 should be assigned to PVC; peaks at 2960, 2873, 1727, 1600, 1461, 1125, 1075, 1040, and 743 cm-1 represented DOP. In Figure 3b, peaks at 2960, 2930, 2874, 1400–1460, 1275, 962, 691, and 617 cm-1 should be assigned to PVC and peaks at 2960, 2874, 1726, 1462, 1074, 1041, and 743 cm-1 should be assigned to DOP. The peak assignment of DOP is listed as follows: 2960 cm-1, 2873 cm-1, CH3CH2stretching mode; 1727 cm-1, C=O stretching mode; 1600 cm-1, benzene ring skeleton vibration; 1461 cm-1, combination CH3asymmetric bending mode and CH2bending mode; 1125 cm-1, C-O symmetric stretching mode; 1075 cm-1, = C-H in ortho substituents of benzene in-plane bending mode; 1040 cm-1, O(CH2)2stretching mode; 743 cm-1, = C-H in ortho substituents of benzene out-plane bending mode. Comparing Figures 3a and 3b, the peaks at 2517, 1794, and 873 cm-1 clearly proved the existence of CaCO3.

Figure 3: IR spectra of (a) PVC with CaCO3and DOP and (b) PVC with DOP.
Several carbonates including Li2CO3, Na2CO3, K2CO3, PbCO3, SrCO3, and MgCO3were also investigated using IR to find the carbonates' characteristics and observe the tiny differences caused by metal ions in IR spectra. The results are shown in Table III. These results indicate that the peaks in the region of 2400–2550 cm-1, 1700–1800 cm-1, 1400–1500 cm-1, 850–880 cm-1, and 690–740 cm-1 were the characteristic absorptions of carbonates. The weak absorption in the 690–740 cm-1 region should be assigned to C-O out-plane bending; the intense absorption in the 850–880 cm-1 region should be assigned to the C-O in-plane bending; and the wide and intensive absorption in the 1400–1500 cm-1 region should be assigned to the C-O stretching vibration. The 1700–1800 cm-1 region might be the typical band of the combination of 1080 cm-1 and 712 cm-1. The weak peak in the 2400–2550 cm-1 region was not reported in the literature and was assumed to be caused by the coupled frequency of 1080 cm-1 and 1440 cm-1 as verified in many carbonates in Table III. MgCO3appeared different from the others because it existed in the hydroxide form and the peaks in the 2400–2550 cm-1 region were too weak to identify. The effects of different metal ions on the IR peak positions are also illustrated in Table III. The tiny, but characteristic differences in IR peak positions would be of great help to identify the carbonates in PVC especially with the lack of elemental analysis instruments such as SEM-EDS.


Table III: Peaks for some carbonates
Raman Spectrum
Figures 2 and 3 illustrate that the intense indicative peaks of CaCO3 near 1400, 870, and 700 cm-1 were all overlapped by the absorption peaks of PVC. Only the weak absorbance at 2517 cm-1 and 1796 cm-1 that were frequencies of combination can be distinguished. Since PVC contains a low amount of CaCO3 in many cases, peaks at 2517 cm-1 and 1796 cm-1 were very weak and sometimes they did not even appear, which made it difficult to detect CaCO3 using IR.

Figure 4: Raman spectrum of PVC.
Figure 4 shows the Raman spectrum of PVC in the bands of 100–1200 cm-1. According to Dollish (15), the main Raman shifts of relative chlorides in liquid solutions and their corresponding vibration modes are as follows: 349 cm-1, C-Cl in trans HClC = CHCl in-plane bending mode; 628 cm-1, C-Cl in Cl2C = CHCl stretching mode; 706 cm-1, C-Cl in H2C = CHCl symmetric stretching mode; 711 cm-1, C-Cl in HClC = CHCl symmetric stretching mode. The vibration modes mentioned above may also exist in the Raman spectra of the PVC products, but the corresponding peak positions shift because of the phase transformation. As shown in Figure 4, the main peaks of PVC in Raman spectrum were 360, 634, 694, 960, 1109, and 1176 cm-1. The peak at 960 cm-1 should be assigned to C-Cl in H2C = CHCl asymmetric stretching mode based on the results from IR (16). Peaks in the 1000–1200 cm-1 region might be assigned to C-C stretching mode and CH2in-plane rocking mode (15).

Figure 5: Raman spectrum of PVC with CaCO3.
Figure 5 shows the Raman spectrum of PVC containing CaCO3. Peaks at 279 cm-1 and 1080 cm-1 were extracted as the indicative peaks of CaCO3. Few peaks were found above 1200 cm-1 in the Raman spectrum of CaCO3. The peak at 1080 cm-1 (CO3stretching vibration) was extremely intense and can be used as the best indicator of carbonates (Figure 6).
Figure 6: Comparison of Raman spectra of PVC with CaCO3and PVC.
Conclusion
In conclusion, we developed a novel method using IR and Raman microscopy to discriminate carbonate-containing and carbonate-free PVC. The results indicate that IR spectroscopy can discriminate not only carbonate-containing and carbonate-free PVC, but different carbonates clearly even without SEM-EDS. In some cases that involve PVC containing a low amount of carbonates, Raman spectroscopy can be effective (when IR spectroscopy is no longer available) with the sensitive indicative peak of carbonates at 1080 cm-1.
Acknowledgment
This study was financially supported by the State Key Laboratory of Environmental Chemistry and Ecotoxicology, Research Center for Eco-Environmental Sciences, Chinese Academy of Sciences (KF2011-09).
Jungang Lv, Jimin Feng, Yong Liu, Zhaohong Wang, and Meng Zhao are with the Procuratoral Technology and Information Research Center, Supreme People's Procuratorate, in Beijing, China. Please direct correspondence to: sdtaljg@163.com.
Wen Zhang is with the Biology Institute of Shandong Academy of Sciences in Jinan, China.
Yanming Cai is with the Agro-Environmental Protection Institute, Ministry of Agriculture in China.
References
(1) A. Sarkar and S. Mahapatra, Cryst. Growth. Des. 10(5), 2129–2135 (2010).
(2) H.M. Zhu, X.G. Jiang, J.H. Yan, Y. Chi, and K.F. Cen, J. Anal. Appl. Pyrol. 82, 1–9 (2008).
(3) Y. Soudais, L. Moga, J. Blazek, and F. Lemort, J. Anal. Appl. Pyrol. 78, 46–57 (2007).
(4) H. Ding and K.S. Li, Polym. Mater. Sci. Eng. 25, 87–89 (2009).
(5) S. Ramesh, K.H. Leen, K. Kumutha, and A.K. Arof, J. Mater. Sci. 66, 1237–1242 (2007).
(6) S.R. Popuri, Y. Vijaya, V.M. Boddu, and K. Abburi, Bioresource. Technol. 100, 194–199 (2009).
(7) M.A. da Silva, M.G. Adeodato Vieira, A.C. Gomes Maçumoto, and M.M. Beppu, Polym. Test. 30, 478–484 (2011).
(8) Y. Zhang, J.Y. Tian, H. Liang, J. Nan, Z.J. Chen, and G.B. Li, J. Environ. Sci. 23, 529–536 (2011).
(9) X.K. Ye, H. Pi, and S.Y. Guo. J. Appl. Polym. Sci. 117, 2899–2906 (2010).
(10) Q.Y. Xie, H.P. Zhang, and L. Tong, J. Hazard. Mater. 179, 373–381 (2010).
(11) N.G. Shimpi, J. Verma, and S. Mishra, J. Compos. Mater. 44, 211–219 (2010).
(12) S. Etienne, C. Becker, D. Ruch, A. Germain, and C. Calberg, J. Thermal. Anal. Calorim. 100, 667–677 (2010).
(13) M.M. Lang, Y.H. Jiao, J.X. Xie, and J.Z. Xu, Plastic. Sci. Technol. 38, 77–80 (2010) (in Chinese).
(14) X.L. Xie, Q.H. Liu, R.K. Yiu Li, X.P. Zhou, Q.X. Zhang, and Z.Z. Yu, Polymer. 45, 6665–6673 (2004).
(15) F.R. Dollish, W.G. Fateley, and F.F. Bentley, Characteristic Raman Frequencies of Organic Compounds (John Wiley, 1974), pp. 50–51.
(16) J.M. Feng, Application of Infrared Spectrometry in the Trace Evidence (Chemistry Industry Press, 2009, in Chinese), pp. 84–86.


Newsletter
Get essential updates on the latest spectroscopy technologies, regulatory standards, and best practices—subscribe today to Spectroscopy.