Article
Spectroscopy
Spectroscopy
The Effect of Microscope Objectives on the Raman Spectra of Crystals
Author(s):
The Raman spectra of a particular face of a single crystal can be significantly different if acquired with different microscope objectives. This article explains the underlying physics of changes in relative intensity and even peak position of certain Raman bands depending on the microscope objective used to acquire the spectrum.
The Raman spectra of a particular face of a single crystal can be significantly different if acquired with different microscope objectives. The purpose of this installment of “Molecular Spectroscopy Workbench” is to inform and educate users of micro-Raman instrumentation of the effect of the microscope objective on the Raman spectra of crystals. Furthermore, we explain the underlying physics of changes in relative intensity and even peak position of certain Raman bands depending on the microscope objective used to acquire the spectrum. Changes in peak position are attributed to phonon directional dispersion sampled through wide-angle microscope objectives with different numerical apertures.
Laser illumination and light collection of Raman spectrometers can involve mirrors, simple lenses, fiber-optic probes, and microscope objectives. The foremost consideration pertaining to these optical elements is how effectively they deliver the laser illumination and collect the Raman scattered light, and how strong the Raman signal is for a given laser power density and spectral acquisition time. Regarding the light-collection optics in particular, the important characteristics include the solid angle of collection and optical throughput. A spectroscopist’s expectation is that the overall signal strength may vary depending on the collection optic used but that the Raman spectrum-that is, the relative intensities of the bands–will not. That expectation is certainly reasonable for Raman spectra acquired from liquids, gases, amorphous materials, glasses, and polycrystalline solids. However, that expectation is not always valid when performing Raman spectroscopy of single crystals or grains. One can observe variations of the peak positions and the relative intensities of Raman bands depending on the optic used to deliver the laser illumination and collect the Raman light. This phenomenon is most evident in the Raman spectra acquired with different microscope objectives. The purpose of this installment of “Molecular Spectroscopy Workbench” is to inform and educate users of micro-Raman instrumentation about the effect of the microscope objective on the Raman spectra of crystals.
One can find detailed theoretical and experimental treatments on the effect of microscope objectives and wide-field collection optics that were published in the early days of micro-Raman spectroscopy (1–3). An excellent source of information on this topic is the chapter written by George Turrell titled “Raman Sampling” in the book Practical Raman Spectroscopy published in 1988 (4). Turrell’s very instructive chapter deals with laser excitation focusing and Raman light collection using wide-angle microscope objectives. Of course, one generally thinks of the microscope objective’s magnification as one of its most important and relevant characteristics. One should also be mindful of the objective’s numerical aperture (NA) and its direct relationship to Raman light collection efficiency. The numerical aperture is defined by the following expression:

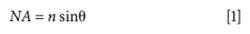

where n is the refractive index of the medium through which the light is passing and θ is the angle between the ray along the optical axis at the center of the lens and the ray from the perimeter of the lens to the sample. Therefore, a microscope objective with a high NA will have a greater solid angle of light collection. However, remember that the NA does not just affect the light collection efficiency. One can envision a variation of the solid angle of the laser beam incident on the sample depending upon the NA of the objective. At the very highest magnification and NA, the laser beam comes to a focus at a very short working distance over a wide angle. This means that the laser beam passing through a 100x objective with a 0.9 NA focused on the sample will not have the same illumination profile as that from a 25-mm-diameter lens with a 40-mm focal length. The microscope objective profile can be thought of as a wide-angle cone consisting of varying angles of incidence, whereas the long-focal-length lens more closely approximates a collimated narrow beam of parallel rays orthogonal to the sample surface. Furthermore, if we define the direction of illumination as the Z-axis, one can expect that the laser light polarization initially in the XY-plane will now have some component along the Z-axis at the wider angles of incidence of a microscope objective. The effect of the microscope objective’s NA on illumination and light collection has significant consequences for the practice of micro-Raman spectroscopy as applied to crystals. We demonstrate these effects through spectra of single-crystal LiNbO3 and KTiOPO4 acquired from objectives with different magnifications and numerical apertures.
Raman Spectroscopy of Single-Crystal LiNbO3
In performing Raman spectroscopy of single crystals, it is important to understand the nomenclature of crystallography. The three crystallographic axes are generally labeled a, b, and c by crystallographers or X, Y, and Z by optical physicists. The crystallographic face is defined by the crystallographic axis normal to that face; that is, the face and axis are orthogonal to each other. For example, one is looking at the Z-face of a crystal if the line of eyesight is parallel to the Z-axis. In a cubic crystal, all three axes have the same refractive index. A uniaxial crystal has two axes with the same refractive index, called the ordinary axes, and the third axis, called the extraordinary axis, has a different refractive index from the ordinary axes. All three of the crystallographic axes of a biaxial crystal have different refractive indices. Uniaxial and biaxial single crystals are ideal for demonstrating the consequences of using wide angle microscope objectives on crystalline materials. LiNbO3 is a uniaxial crystal whose ordinary and extraordinary refractive indices at 530 nm are no = 2.3247 and ne = 2.2355, respectively (5). A correlation exists between the directionally dependent dielectric properties and the corresponding Raman tensors of single crystals. Moreover, the Raman spectrum acquired from a single crystal depends on the crystal class to which the crystal belongs, the crystal’s orientation relative to the direction and polarization of the incident light, and the collection angle and polarization of the Raman scattered light.
LiNbO3 belongs to the C3v crystal class for which the Raman tensors are

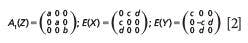
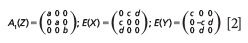
where the letter in parentheses next to the symmetry species indicates the crystallographic direction of the lattice vibrational mode polarization. The irreducible representations of the LiNbO3 vibrational modes are

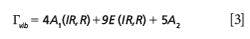
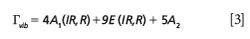
The 4A1 and 9E modes are infrared and Raman active, whereas the 5A2 modes are silent. Raman spectra acquired from the X-face of a single crystal of uniaxial LiNbO3 are shown in Figure 1. Spectroscopic selection rules predict that these Raman bands will belong to the symmetry species A1(TO) and E(TO), where the symbols TO and LO stand for the transverse and longitudinal optical modes, respectively. The spectra were acquired using 10x (NA 0.25), 50x LWD (NA 0.50), 50x (NA 0.75), 100x LWD (NA 0.75), and 100x (NA 0.90) microscope objectives. The laser beam was incident upon the X-face and polarized parallel to the Y-axis, one of the ordinary axes. No Raman analyzer was used in the collection of these or any other spectra presented in this work. The five spectra are plotted normalized and appear to be nearly identical, independent of the microscope objective used for laser delivery and light collection. This is the type of response, independent of microscope objective, which many users of Raman instrumentation may incorrectly expect of all crystallographic Raman measurements. However, rotate the incident polarization by 90° such that the incident laser polarization is now parallel to the Z-axis, the extraordinary axis, and one observes entirely different Raman spectra. The b Raman tensor element of the A1 mode now dominates the spectra shown in Figure 2.

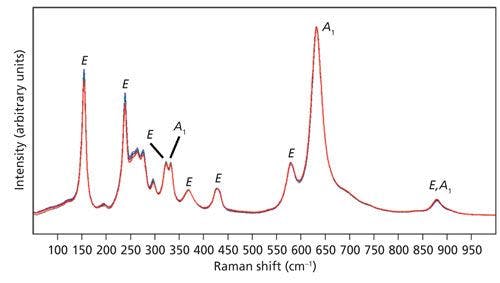
Figure 1: Raman spectra of the X-face of a single crystal of LiNbO3 with the incident laser light polarized along the Y-axis. Spectra were acquired using 10x (brown), 50x LWD (blue), 50x (green), 100x LWD (navy), and 100x (red) microscope objectives. The symbols A1 and E are the symmetry species to which the bands have been assigned.
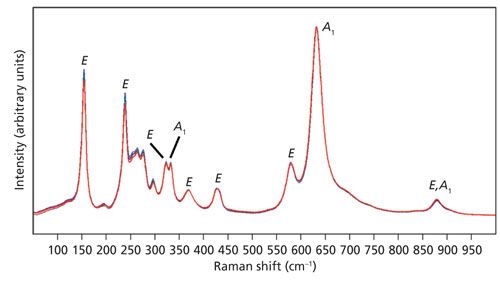

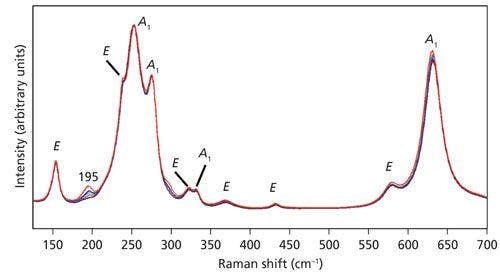
Figure 2: Raman spectra of the X-face of a single crystal of LiNbO3 with the incident laser light polarized along the Z-axis. Spectra were acquired using 10x (brown), 50x LWD (blue), 50x (green), 100x LWD (navy), and 100x (red) microscope objectives. The symbols A1 and E are the symmetry species to which the bands have been assigned.
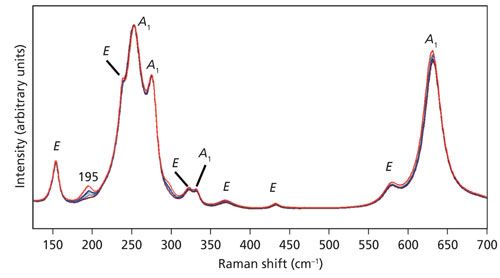
The Z-axis polarized spectra are significantly different from those obtained with the incident light polarized parallel to the Y-axis. Most of the bands appearing in the Y-polarized spectra of Figure 1 are attributed to the E symmetry species, whereas the most pronounced bands in the Z-polarized spectra of Figure 2 belong to the A1 symmetry species. These differences arise because of the Raman polarization selection rules and the interplay of incident and scattered light direction, polarization, and the orientation of the crystal. Selection rules predict that these X-face Raman bands excited with laser light polarized along the Z-axis in the backscattering configuration will belong to the symmetry species A1(TO) and E(TO). Most of the Raman bands appear to be of near identical relative strength, independent of the microscope objective used to acquire the spectrum. However, notice that the intensity of a single band at 195 cm-1 depends on the microscope objective used to deliver the laser beam and collect the Raman scattered light. The 195 cm-1 band is absent in the spectrum acquired using the 10x objective and increases progressively with the 50x LWD, 50x, 100x LWD, and 100x objectives. Moreover, the 195 cm-1 band has been assigned to the E(LO) symmetry species and is not expected in this configuration (6–9). Why would a Raman band forbidden in this experimental configuration appear in the spectra and why would its relative intensity vary depending on the microscope objective used? The answer to this question can be found in Table I, which shows the numerical apertures of the objectives used.

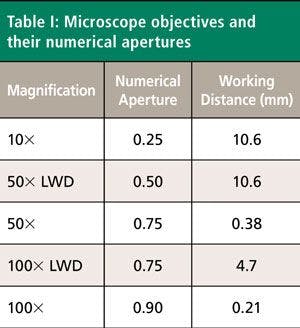
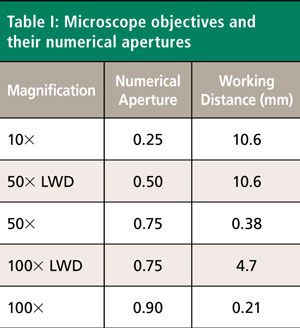
The numerical aperture is a measure of the solid angle of light collection of the microscope objective. A large NA value corresponds to a greater solid angle. In this case, the NA has implications for the laser beam profile incident on the sample. Ideally, one would like to fill the back aperture with the laser beam such that it comes to a diffraction limited spot in the field of view. Not all the rays envisioned travelling down the barrel of the microscope objective will reach the laser spot at the same angle of incidence. The objective with the greatest NA will cause the rays passing through the lens near the perimeter to refract at the largest angle. Therefore, one can envision a distribution of angles of incidence on the sample that is dependent on the numerical aperture. The field of view may be normal to the X-face, but that does not mean that all of the rays from the objective will be parallel to the X-axis. Some will be incident on the sample at wide angles commensurate with the numerical aperture. Thus, we see with increasing NA the emergence of the 195 cm-1 band that has been assigned to the E(LO) symmetry species and should not be observed under this 180° backscattering experimental configuration. These types of differences in Raman spectra that are dependent on the objective used can easily go unnoticed by one not skilled in the practice of Raman spectroscopy. The purpose of this installment is to make users aware of this phenomenon and to explain its origin.
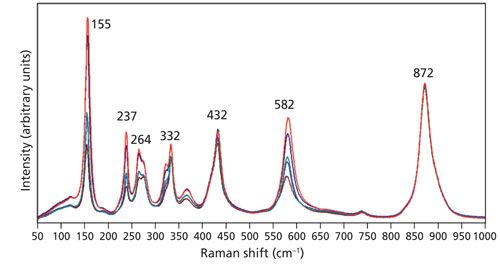
Rotation of the crystal by 90° about the Y-axis allows the laser beam to now be parallel to the extraordinary axis (Z-axis) and incident upon the Z-face. The perpendicular X- and Y-axes are the ordinary axes with identical refractive indices. Spectra were acquired using 10x (NA 0.25), 50x LWD (NA 0.50), 50x (NA 0.75), 100x LWD (NA 0.75), and 100x (NA 0.90) microscope objectives and are shown in Figure 3. Selection rules predict that these Z-face Raman bands excited with laser light polarized along the X-axis in the backscattering configuration will belong to the symmetry species A1(LO) and E(TO). The spectra have been normalized to the A1(LO) band at 872 cm-1, thereby revealing the changes in relative intensities of all the other bands as a function of the microscope objective used. The contrast with the spectra in Figure 1 is quite stark where there were no differences among the spectra acquired with different objectives. Here, we see that all of the Raman bands, to a greater or lesser degree, vary with intensity depending on the objective used. All of the Raman bands in Figure 3 follow the same pattern. The strength of a given band increases relative to that of the 872 cm-1 band progressively with the 10x, 50x LWD, 50x, 100x LWD, and 100x objectives. It is important to note that all the bands do not increase in signal strength by the same proportion relative to the 872 cm-1 band. For example, the bands at 155 and 582 cm-1 are both weaker than the 872 cm-1 band in the spectrum acquired with the 10x objective. However, in the spectrum acquired using the 100x objective the signal strength of the 155 cm-1 band now significantly exceeds that of the 872 cm-1 band whereas the signal strength of the 582 cm-1 band is still less than that of the 872 cm-1 band. There are other ways of viewing and analyzing this same phenomenon; we could have plotted the spectra normalized to any of the other bands to see the relative signal strength variations dependent on the microscope objective. The variations in relative signal strengths are because of a change in the distribution of angles of incidence as we use objectives with increasing numerical aperture. The 10x objective with NA of 0.25 comes the closest of those used here to deliver a laser beam parallel to the crystallographic axis. As the NA of the objective is increased, one can envision more rays incident on the sample at oblique angles rather than just those closely parallel to the crystallographic axis. Consequently, Raman bands that would be expected were the laser beam to be incident at an oblique angle with respect to the light-collection axis appear unexpectedly in the backscattering configuration.

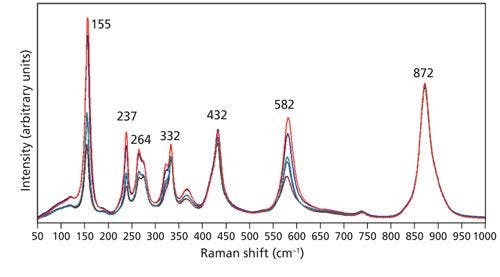
Figure 3: Raman spectra of the Z-face of a single crystal of LiNbO3 with the incident laser light polarized along the X-axis. Spectra were acquired using 10x (brown), 50x LWD (blue), 50x (green), 100x LWD (navy), and 100x (red) microscope objectives.
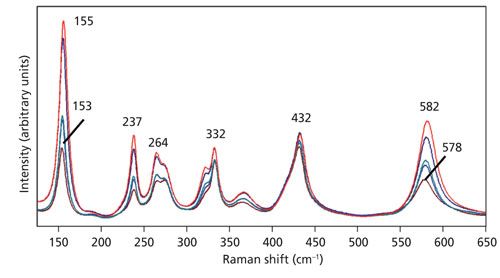
Not only do we observe a change in the relative intensities, some bands manifest a shift in peak position as an objective with higher numerical aperture is used. The spectra of Figure 3 are shown in an expanded scale in Figure 4 to more clearly see the relative intensity changes and, in some cases, peak shifts. Specifically, note that the 153 and 578 cm-1 bands in the spectrum acquired using the 10x objective shift to 155 and 582 cm-1, respectively in the spectrum acquired with the 100x objective. The bands at 237, 264, 332, and 432 cm-1 are fixed, showing no shift when using different microscope objectives. What accounts for the shift in peak position of some bands but not others? The answer is phonon directional dispersion.
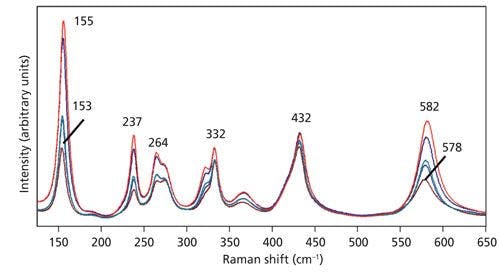
Figure 4: Raman spectra of the Z-face of a single crystal of LiNbO3 with the incident laser light polarized along the X-axis. Spectra were acquired using 10x (brown), 50x LWD (blue), 50x (green), 100x LWD (navy), and 100x (red) microscope objectives.
Consider the case of laser light propagating along a general direction in a crystal and not parallel to a crystallographic axis. Such light can excite lattice vibrational waves that resolve into longitudinal and transverse waves. The frequency of the longitudinal phonon is higher than that of the transverse phonon. If our phonon is propagating in a general direction, we may expect to see a splitting and two Raman bands associated with the LO and TO phonons. That behavior can be expected if the plane contains only the two ordinary axes of the uniaxial crystal. However, the situation is quite different if the exciting radiation is propagating in a plane containing the extraordinary axis, either the XZ- or YZ-planes. Now the short-range atomic forces that lead to the extraordinary refractive index and different vibrational force constants of the unique axis play a role. If these forces are greater than the long-range forces that lead to the splitting of longitudinal and transverse phonons, then a phonon of mixed longitudinal and transverse character will be launched by the exciting radiation. Thus, instead of a splitting of the Raman bands because of the LO and TO phonons, one will observe a single Raman band of mixed LO and TO character dependent on the direction of propagation in the crystal. Imagine a laser beam initially directed along the Z-axis of a single crystal of LiNbO3. If Raman spectra were acquired as the crystal is rotated about the Y-axis in small rotational increments until the laser beam was finally directed along the X-axis, one would observe that some peaks shift to higher wavenumber as the laser illumination rotates from the Z-axis to the X-axis. Those lattice vibrational modes most affected by short range atomic forces will be of mixed LO and TO character and their energies will depend on the direction of propagation through the crystal lattice. This phenomenon is known as phonon directional dispersion. A detailed theoretical treatment can be found in the book by Sherwood (10).
A plot of experimentally obtained phonon directional dispersion of the Raman bands of LiNbO3 is shown in the publication by Maimounatou and colleagues (9). We see the greatest dispersion for the E(TO) bands that appear at 153 and 578 cm-1 when the exciting beam is parallel to the Z-axis. The 153 and 578 cm-1 bands convert to E(LO) and A1(TO) modes, respectively as the crystal is rotated 90° such that the incident beam is finally parallel to the X-axis. The phonon directional dispersion shown in Figure 4 of the Maimounatou publication is consistent with the change in Raman peak position as microscope objectives with higher numerical aperture and greater off-axis illumination is used.
Raman Spectroscopy of Single-Crystal KTiOPO4
Unlike the uniaxial crystal LiNbO3, KTiOPO4 is a biaxial crystal whose three refractive indices at 530 nm are nx = 1.7787, ny = 1.7924, and nz = 1.8873, respectively (11). Like LiNbO3, KTiOPO4 is a ferroelectric crystal at room temperature with high nonlinear susceptibilities and electrooptic coefficients. Both crystals are commonly used for frequency doubling. The 532-nm laser is produced by guiding the 1064-nm beam from a Nd:YAG laser through a crystal such as LiNbO3 or KTiOPO4 oriented appropriately to achieve phase matching. Here we continue our examination of the effect of microscope objective numerical aperture on the Raman spectra of KTiOPO4.
KTiOPO4 belongs to the C2v crystal class for which the Raman tensors are

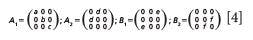
The irreducible representations of the vibrational modes are


The 47A1, 48A2, 47B1, and 47B2 modes are Raman active, leading to a Raman spectrum much more complicated than that of LiNbO3. Nevertheless, we see the same phenomena and patterns as a function of microscope objective as we did with our spectra of LiNbO3.
Raman spectra obtained of the Z-face with the laser beam guided along the Z-axis with the light polarized parallel to the Y-axis are shown in Figure 5. The spectra were acquired using 10x (NA 0.25), 50x LWD (NA 0.50), 50x (NA 0.75), 100x LWD (NA 0.75), and 100x (NA 0.90) microscope objectives. All of the spectra are plotted normalized to the 765 cm-1 band. It is clear that many of the bands manifest the same intensity relative to that of the 765 cm-1 band independent of the microscope objective used. However, note how the strengths of the bands at 268, 327, 637, and 702 cm-1 vary depending on the objective used. In particular, the 702 cm-1 band is absent in the spectrum acquired with the 10x objective. It appears first in the spectrum acquired using the 50x LWD objective and grows progressively more intense as the numerical aperture increases through the 50x, 100x LWD, and 100x objectives. The behavior is much like that of the LiNbO3 band at 195 cm-1 in Figure 2.

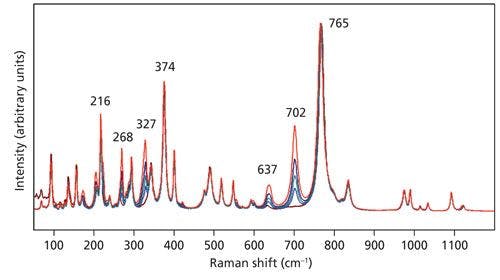
Figure 5: Raman spectra of the Z-face of a single crystal of KTiOPO4 with the incident laser light polarized along the Y-axis. Spectra were acquired using 10x (brown), 50x LWD (blue), 50x (green), 100x LWD (navy), and 100x (red) microscope objectives.
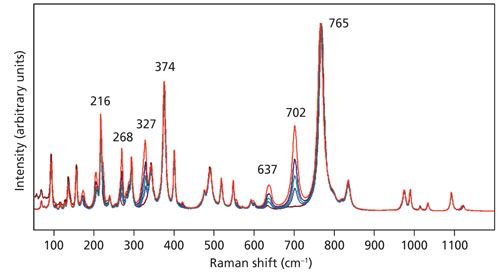
Expansion of the scale in the spectral region below 425 cm-1 shown in Figure 6 allows one to more clearly see the changes in relative strength of the bands at 268 and 327 cm-1 when compared to those invariant at 342, 375, and 400 cm-1. The latter are of identical strength independent of the microscope objective used to acquire the spectrum. We observe the same progression in these spectra of KTiOPO4 as we did for LiNbO3, depending on the microscope objective used. The changes in relative band strength can be accounted for and explained with respect to the increasing numerical aperture. As the numerical aperture increases, so does the distribution of angles of incidence of the exciting laser beam.

Figure 6: Raman spectra of the Z-face of a single crystal of KTiOPO4 with the incident laser light polarized along the Y-axis. Spectra were acquired using 10x (brown), 50x LWD (blue), 50x (green), 100x LWD (navy), and 100x (red) microscope objectives.

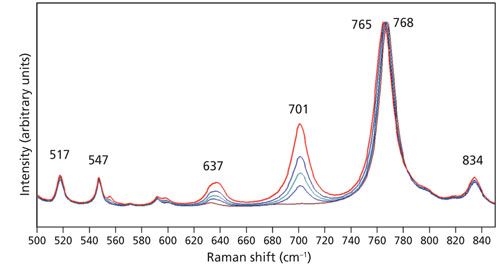
We observed the phenomenon of phonon directional dispersion in our spectra of the Z-face of LiNbO3 and so we might expect to observe the same effect in our spectra of KTiOPO4, especially with the exciting beam nominally parallel to the Z-axis. Recall that nz = 1.8873 and is substantially greater than nx = 1.7787 and ny = 1.7924. Therefore, the short range and anisotropic atomic forces leading to this birefringence should lead us to expect phonon directional dispersion in KTiOPO4. Indeed, one can see in Figure 6 that the band at 328 cm-1 obtained with the 50x LWD objective shifts to 327 cm-1 in the spectrum acquired using the 100x objective. An expanded view of these same spectra in the region from 500 to 850 cm-1 is shown in Figure 7. The band at 768 cm-1 has been assigned to an A1(LO) mode (12). Here we see that the 517, 547, 701, and 834 cm-1 bands remain fixed, independent of the objective used to acquire the spectra. However, the intense band at 768 cm-1 acquired using the 10x objective shifts progressively to a lower wavenumber with increasing numerical aperture until reaching a value of 765 cm-1 in the spectrum acquired with the 100x objective. The progression of phonon directional dispersion to a lower wavenumber with increasing numerical aperture observed for KTiOPO4 is the opposite of that observed for LiNbO3 where the bands shifted to a higher wavenumber. We can attribute the different responses to the different anisotropic short-range atomic forces of KTiOPO4 and LiNbO3. The Z-axis or extraordinary refractive index (ne = 2.2355) of LiNbO3 is less than that of the ordinary refractive index (no = 2.3247). Conversely, the Z-axis refractive index (nz = 1.8873) of KTiOPO4 is greater than either nx = 1.7787 or ny = 1.7924. Consequently, the phonon energies shift in a direction commensurate with the positive or negative values of the birefringence.
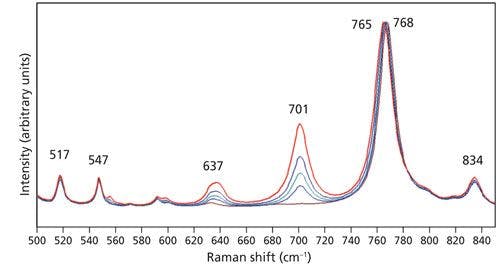
Figure 7: Raman spectra of the Z-face of a single crystal of KTiOPO4 with the incident laser light polarized along the Y-axis. Spectra were acquired using 10x (brown), 50x LWD (blue), 50x (green), 100x LWD (navy), and 100x (red) microscope objectives.
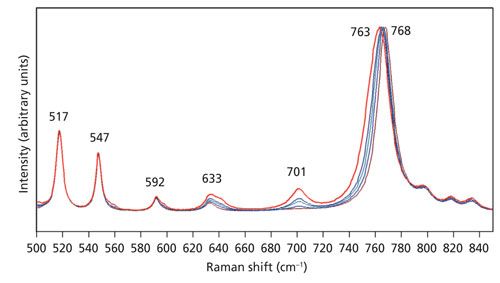
The polarization of the incident beam also plays an important role. The spectra of the Z-face shown in Figures 5–7 were all obtained with the incident laser light polarized parallel to the crystallographic Y-axis. Spectra of the Z-face with incident laser light polarized parallel to the X-axis are shown in Figure 8. The spectra appear similar but are not identical to those shown in Figure 7. In particular, note that the phonon directional dispersion of the A1(LO) band is greater as it progressively shifts from 768 cm-1 acquired using the 10x objective to lower wavenumber with increasing numerical aperture until reaching a value of 763 cm-1 in the spectrum acquired with the 100x objective. The phonon directional dispersion of the A1(LO) mode is even greater for light polarized parallel to the X-axis than it is for light polarized along the Y-axis. Therefore, one needs to be cognizant of the polarization of the incident laser light along with the numerical aperture of the microscope objective when acquiring Raman spectra with a microscope based instrument.

Figure 8: Raman spectra of the Z-face of a single crystal of KTiOPO4 with the incident laser light polarized along the X-axis. Spectra were acquired using 10x (brown), 50x LWD (blue), 50x (green), 100x LWD (navy), and 100x (red) microscope objectives.
Conclusion
The numerical aperture is a measure of the solid angle of light collection of the microscope objective. A microscope objective with a high NA will have a greater solid angle of light collection. The NA also has implications for the laser beam profile incident on the sample. The objective with the greatest NA will cause the rays passing through the lens near the perimeter to refract at the largest angle. Therefore, one can envision a distribution of angles of incidence that is dependent on the numerical aperture. Consequently, Raman bands that would be expected were the laser beam to be incident at an oblique angle with respect to the light collection axis appear unexpectedly in the backscattering configuration. We observe a change in the relative intensities and some bands manifest a shift in peak position as an objective with higher numerical aperture is used. This phenomenon can be attributed to phonon directional dispersion. The field of view may be normal to a particular crystal face, but that does not mean that all of the rays from the objective will be parallel to that crystallographic axis. Therefore, one needs to be cognizant of the numerical aperture of the microscope objective when acquiring Raman spectra of single crystals or grains with a microscope based instrument.
References
- G. Turrell, J. Raman Spec. 15, 103–108(1984).
- C. Bremard, J. Laureyns, J.-C. Merlin, and G. Turrell, J. Raman Spec. 18, 305–313(1987).
- C. Bremard, P. Dhamelincourt, J. Laureyns, and G. Turrell, Appl. Spec.39, 1036–1039 (1985).
- G. Turrell, in Practical Raman Spectroscopy, D.J. Gardiner and P.R. Graves, Eds. (Springer-Verlag, Berlin, 1989), pp. 13–54.
- A.M. Prokhorov and Y.S. Kuz’minov, Physics and Chemistry of Crystalline Lithium Niobate (Adam Hilger, Bristol, 1990), p. 199.
- S. Margueron, A. Bartasyte, A.M. Glazer, E. Simon, J. Hlinka, and I. Gregora, J. Appl. Phys.111, 104105 (2012).
- M.D. Fontana and P. Bourson, Appl. Phys. Rev. 2, 040602 (2015).
- S. Sanna, S. Neufeld, M. Rüsing, G. Berth, A. Zrenner, and W.G. Schmidt, Phys. Rev. B91, 224302 (2015).
- B. Maimounatou, B. Mohamadou, and R. Erasmus, Phys. Status Solidi B253, 573–582 (2016).
- P.M.A. Sherwood, Vibrational Spectroscopy of Solids (Cambridge University Press, London, 1972), pp. 83–115.
- A.M. Prokhorov and Y.S. Kuz’minov, Ferroelectric Crystals for Laser Radiation Control (Adam Hilger, Bristol, 1990), p. 307.
- M. Rüsing, C. Eigner, P. Mackwitz, G. Berth, C. Silberhorn, and A. Zrenner, J. Appl. Phys.119, 044103 (2016).


David Tuschel is a Raman applications manager at Horiba Scientific, in Edison, New Jersey, where he works with Fran Adar. David is sharing authorship of this column with Fran. He can be reached at: SpectroscopyEdit@UBM.com


Newsletter
Get essential updates on the latest spectroscopy technologies, regulatory standards, and best practices—subscribe today to Spectroscopy.