Article
Spectroscopy
Spectroscopy
The Carbonyl Group, Part I: Introduction
Author(s):
An introduction to the IR spectroscopy of the carbonyl group, exploring why the peak is intense and showing how to apply that knowledge to the analysis of the spectra of ketones
The carbonyl or C=O group is the perfect functional group for detection by infrared (IR) spectroscopy because its stretching vibration peak is intense and is located in a unique wavenumber range. In this introduction to the IR spectroscopy of the carbonyl group we explore why the peak is intense, and see how to apply that knowledge to the analysis of the spectra of ketones.
Across all the installments I have written so far there has been an overarching structure: Each large section has been devoted to the infrared (IR) spectroscopy of a specific chemical bond. We started with the C-H bond, moved on to the C-O bond, and now it is time to discuss the spectroscopy of the C=O or carbonyl group. These bonds are very common and are found in ketones, aldehydes, esters, and carboxylic acids, among others. The types of materials where you will find carbonyl groups include polymers, proteins, fats, solvents, and pharmaceuticals.
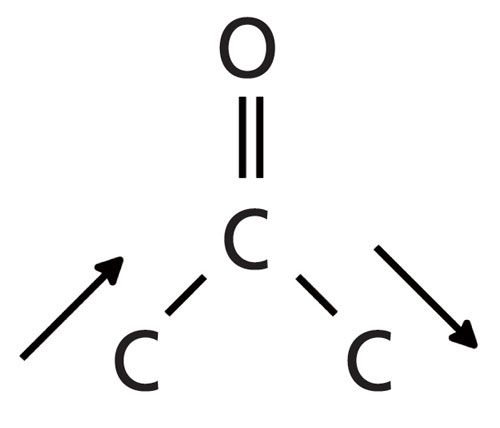
The carbon in a C=O bond is referred to as the “carbonyl carbon” as shown in Figure 1.

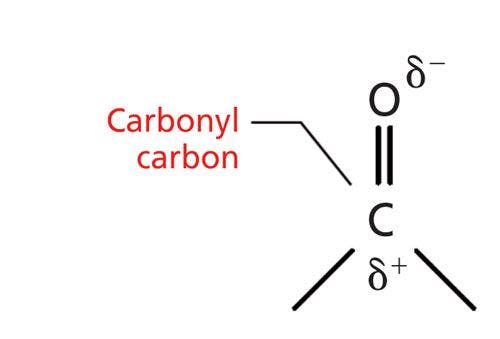
Figure 1: The chemical structure and charge distribution in a carbonyl bond.
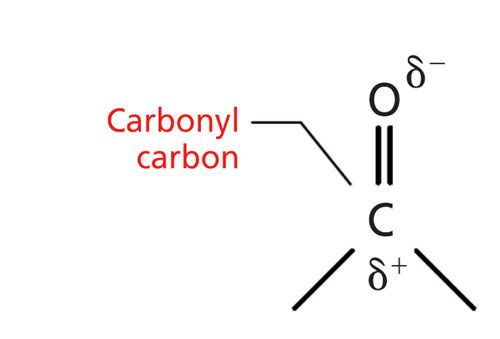
Carbonyl bonds are highly polar because of the large electronegativity difference between carbon and oxygen. As a result, the carbonyl carbon has a large partial positive charge and the oxygen has a large partial negative charge as denoted in Figure 1. Recall that in a chemical bond when there are two charges separated by a distance it forms what is called a dipole moment (1). Additionally, remember that one of the characteristics that determines the intensity of infrared peaks is the change in dipole moment with respect to bond length, dµ/dx, during a molecular vibration (1).
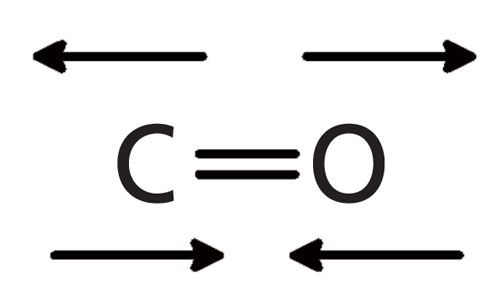
Since the carbonyl group has a large dipole moment, when this group stretches and contracts the value of dµ/dx is large, thereby giving an intense peak. This vibration is illustrated in Figure 2.


Figure 2: The stretching vibration of a carbonyl bond.
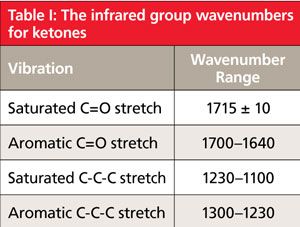
Carbonyl stretching peaks generally fall between 1900 and 1600 cm-1 (assume all peak positions hereafter are in wavenumber units), a relatively unique part of the IR spectrum. This area is sometimes referred to as the carbonyl stretching region as a result. The carbonyl stretching peak is perhaps the perfect example of a group wavenumber, a peak that shows up intensely in a unique and relatively narrow wavenumber range. This attribute makes C=O stretches one of the easiest IR peaks to spot and assign. Because of this trait, an IR spectrometer is, in some respects, the perfect carbonyl detector.
Carbonyl bonds can be divided into two classes depending on what type of carbons are attached to the carbonyl carbon. A saturated carbonyl group has two saturated carbons attached to the carbonyl carbon. An aromatic carbonyl group has one or more aromatic carbons attached to the carbonyl carbon. An example of an aromatic carbonyl group is shown in Figure 3.

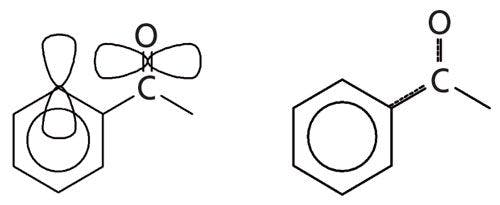
Figure 3: The p-type orbitals and conjugation within an aromatic carbonyl group.

Saturated and aromatic carbonyl groups can be distinguished from each other using IR spectroscopy. In general, aromatic C=O stretching peaks fall ~30 cm-1 lower than saturated C=O stretching peaks. This is because aromatic rings, such as benzene, contain p-type orbitals with electron density that sticks up out of the plane of the molecule (2) as illustrated to the left in Figure 3. The carbonyl group also contains a p-type orbital that points through space toward the orbitals on the aromatic ring, Figure 3. The orbitals are close enough that they somewhat overlap, allowing some of the electron density from the carbonyl bond to be pulled off into the benzene ring in a phenomenon known as conjugation, which is illustrated at right in Figure 3. Conjugation weakens the C=O bond, lowers its force constant, and hence its peak position is lowered, on average about 30 cm-1 (1). Thus, for almost every carbonyl containing functional group we discuss I will quote two carbonyl stretching regions, one for the saturated and one for the aromatic versions of the functional group.
The IR Spectroscopy of Ketones
Perhaps one of the most common chemical structures to contain a carbonyl group are ketone molecules. Ketones consist of a C=O with two carbons attached, one to the left and one to the right as illustrated in Figure 4.

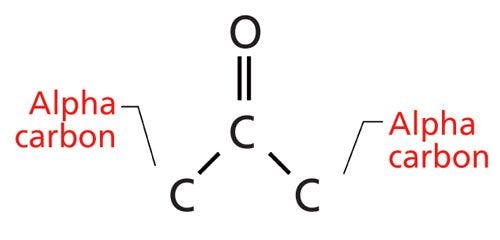
Figure 4: The structural framework of the ketone functional group.

Note that the carbons attached to the carbonyl carbon are denoted “alpha carbons.”
A common example of a ketone-containing molecule is acetone (dimethyl ketone), whose IR spectrum is shown in Figure 5.

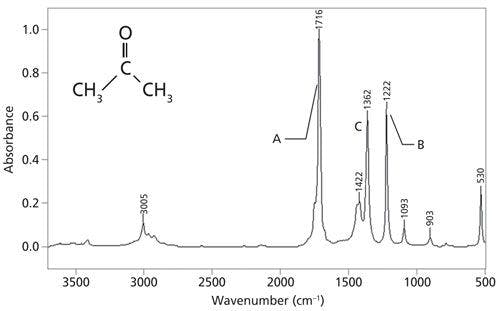
Figure 5: The infrared spectrum of acetone, C3H6O.
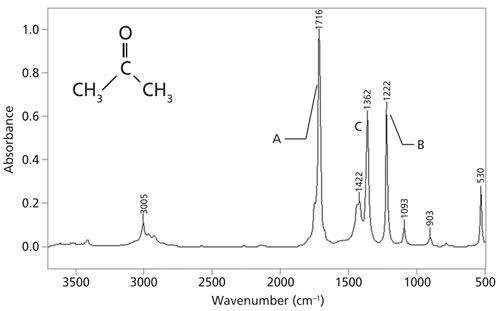
The carbonyl stretch of acetone falls at 1716, and is labeled A in Figure 5. In general, for saturated ketones this peak appears at 1715 ± 10. Note how large this peak is, easily the biggest in the spectrum. This is common for the carbonyl stretches of many functional groups.
It is tempting to assume that the carbonyl stretching peak for ketones uniquely identifies them, but this is not the case. Saturated esters, aldehydes, and carboxylic acids, amongst others, have their C=O stretching peaks around 1715. Thus, we will see that the C=O stretching peak is diagnostic for carbonyl groups but not for anything else. We will be dependent upon other peaks in IR spectra besides the C=O stretch to distinguish the different types of carbonyl containing functional groups from each other.
For ketones, the peak that can help distinguish them from other functional groups is the C-C-C stretch vibration, which is illustrated in Figure 6.

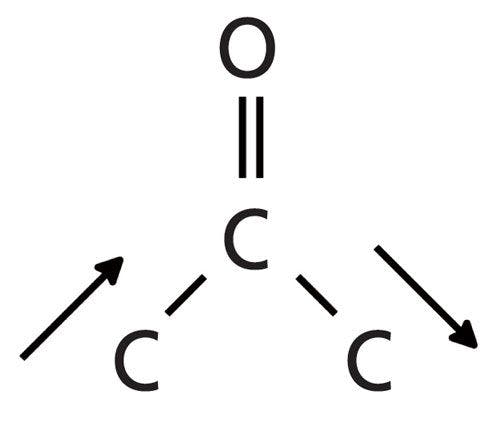
Figure 6: The C-C-C stretching vibration of ketones.
Note that this vibration involves the two alpha carbons stretching asymmetrically about the carbonyl carbon. This vibration gives rise to an intense peak between 1230 and 1100 for saturated ketones. This peak appears in the spectrum of acetone at 1222 and is labeled B. Note it is the second largest peak in the spectrum.
Normally a C-C stretching vibration peak is small because the electronegativity difference between two carbon atoms is often negligible, giving nonpolar bonds and small values of dµ/dx. However, the carbonyl carbon in the C=O bond has a large positive partial charge on it, as shown in Figure 1. This charge polarizes the bonds to the two alpha carbons, and when these C-C bonds stretch dµ/dx is large, giving the typically large ketone C-C-C stretching peak labeled B in Figure 5.
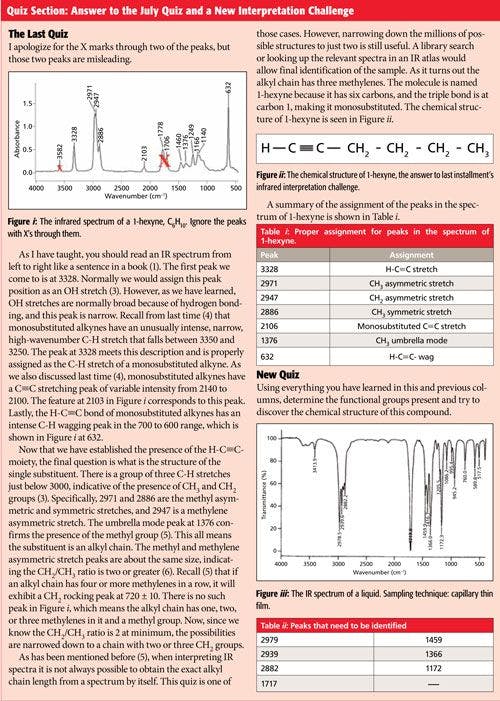
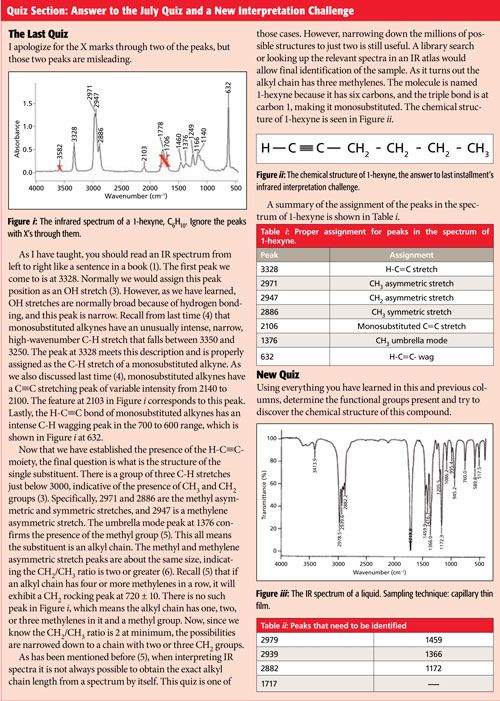
The chemical structure of an aromatic ketone, acetophenone, is shown in Figure 7. Note that although there is an aromatic and a saturated carbon attached to the carbonyl carbon in acetophenone, it is considered an aromatic ketone. This is because it only takes the presence of a single aromatic substituent to engage in conjugation and lower the carbonyl stretching peak position. The IR spectrum of acetophenone (phenyl methyl ketone) is also shown in Figure 7.

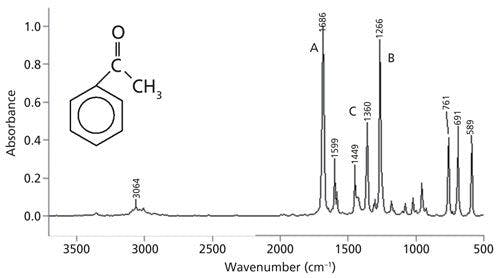
Figure 7: The IR spectrum of acetophenone (phenyl methyl ketone), C6H8O.
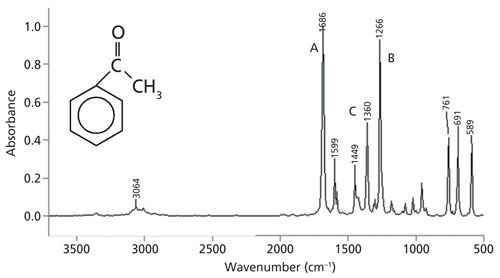
The carbonyl stretch, labeled A, is at 1686, while the C-C-C stretch, labeled B, is at 1266. For aromatic ketones, generally the C-C-C stretch falls between 1300 and 1230. Note that these are the two most intense peaks in the spectrum. Structurally acetophenone differs from acetone because a methyl group has been replaced by a phenyl group. Thus, the C=O stretching peak in acetophenone is 30 cm-1 lower than in acetone because of conjugation. A summary of the group wavenumbers for ketones is shown in Table I.

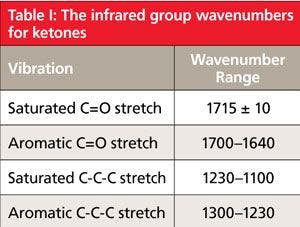
Note that both the C=O stretch and the C-C-C stretch are sensitive as to whether a ketone is saturated or aromatic, so either one of these peaks can be used to distinguish saturated and aromatic ketones from each other. The C=O and C-C-C stretching peaks are the best peaks to use to determine if there is a ketone in a sample.
Methyl Ketones and Their Umbrella Mode
A methyl ketone is a structure where one or more of the substituents on the carbonyl carbon is a methyl group. Both acetone and acetophenone are examples of methyl ketones. Previously we learned (2) that methyl groups in alkyl chains have an umbrella mode around 1375, and we also observed that this peak was medium to weak in intensity. The methyl groups in acetone and acetophenone also exhibit an umbrella mode at 1362 and 1360 respectively, labeled C in Figures 5 and 7. Note how intense these two umbrella mode peaks are: In both cases they are the third biggest peak in the spectrum, and in the case of acetone the umbrella mode is almost as big as the C-C-C stretch!
This intense CH3 umbrella mode is indicative of a methyl ketone. Thus, if your analysis of a spectrum indicates that a ketone and methyl group are present, and the CH3 umbrella mode is unusually large, it is a good bet you have a methyl ketone. This peak is diagnostically very useful. After a ketone is identified the next step is to determine the two substituents attached to the carbonyl carbon. The large methyl ketone umbrella mode tells us that one of the substituents is a CH3 group.

CLICK IMAGE TO ENLARGE
Conclusions
The carbonyl group, C=O, has a large dipole moment and thus an intense stretching vibration whose peak generally appears from 1900 to 1600. When an aromatic ring is attached to a carbonyl carbon, the C=O stretching peak position is lowered by about 30 cm-1 because of a phenomenon known as conjugation. Ketones are a type of carbonyl containing functional group with two carbons attached to the carbonyl carbon. They exhibit diagnostically useful C=O and C-C-C stretches, both of whose peak positions are sensitive as to whether the ketone is saturated or aromatic. Methyl ketones display a unique high-intensity CH3 umbrella mode.
References
- B.C. Smith, Spectroscopy30(1), 16–23 (2015).
- B.C. Smith, Spectroscopy31(3), 34–36 (2016)
- B.C. Smith, Spectroscopy32(1), 14–21 (2017).
- B.C. Smith, Spectroscopy32(7), 18–24 (2017).
- B.C. Smith, Spectroscopy30(7), 26–31, 48 (2015).
- B.C. Smith, Spectroscopy30(9), 40–45 (2015).


Brian C. Smith, PhD, is the West Coast Business Development Manager for CAMO Software, a company that sells chemometric, multivariate analysis, and process control software. Before joining CAMO, Dr. Smith ran his own FT-IR training and consulting business for more than 20 years. Dr. Smith has written three books on infrared spectroscopy: Fundamentals of FTIR and Infrared Spectral Interpretation, both published by CRC Press, and Quantitative Spectroscopy: Theory and Practice published by Academic Press. He can be reached at: SpectroscopyEdit@UBM.com


Newsletter
Get essential updates on the latest spectroscopy technologies, regulatory standards, and best practices—subscribe today to Spectroscopy.


