We explain how to characterize barium fluorohalides with Raman spectroscopy.

David Tuschel is a Raman applications manager at Horiba Scientific in Edison, New Jersey, where he works with Fran Adar. David is sharing authorship of the "Molecular Spectroscopy Workbench" column with Fran.
We explain how to characterize barium fluorohalides with Raman spectroscopy.

To better understand Raman spectral profiles, we briefly examine spectral line shapes, while discussing spectral shape, bandwidth, and broadening as percentage of Gaussian and Lorentzian components.
Raman and photoluminescence spectroscopy were combined with imaging to examine the spatial variation of solid-state structure and electronic character of two-dimensional (2-D) tungsten disulfide (WS2) crystals, which represent a family of new inorganic 2-D materials.

Raman spectroscopy is extremely useful for characterizing crystalline materials.

A Raman spectrometer’s spectral resolution is determined by its spectral dispersion in conjunction with the entrance slit width. We explain the instrument design parameters involved.

Spectroscopy
Raman imaging provides detailed crystal orientation information for two-dimensional MoS2 prepared by chemical vapor deposition on silicon substrates. These two-dimensional crystals consist of individual atomic layers of sulfur, molybdenum, and sulfur atoms.
Spectroscopy
Raman measurements can be used to infer the temperature of a material based on the Stokes and anti-Stokes band signal strengths, and by applying a predefined mathematical relationship. In reality, the temperature, Raman shift, and laser excitation wavelength all interact, and should be considered to better understand these measurements.
Spectroscopy
When stress is applied to an object, it can produce strain. Strain can be detected through changes in peak position and bandwidth in Raman spectra. Here, we show examples of how strain in technologically important materials appears in the Raman spectra.
Spectroscopy
Resonance Raman spectroscopy demonstrates up to 106 signal enhancement. In this overview a detailed description of how resonance Raman spectroscopy differs from normal Raman spectroscopy is given with some specific examples explained.
Spectroscopy
Raman spectroscopy is a convenient method for probing the chemical bonding and solid state structure of crystals, and it is sensitive to the presence of dopants, impurities, and crystal defects in the host-crystal lattice. Here is what you need to know about how a hostcrystal Raman spectrum is affected by dopants and impurities.
Spectroscopy
The Raman spectra of a particular face of a single crystal can be significantly different if acquired with different microscope objectives. This article explains the underlying physics of changes in relative intensity and even peak position of certain Raman bands depending on the microscope objective used to acquire the spectrum.
Spectroscopy
The Raman spectra of crystalline and amorphous solids of the same chemical composition can be significantly different primarily because of the presence or absence of spatial order and long range translational symmetry, respectively. The purpose or goal of this installment of Molecular Spectroscopy Workbench is to help readers understand the underlying physics that affect the Raman spectra of crystalline and amorphous solids. Wave vector, reciprocal space, and the Brillouin zone are explained with respect to Raman spectroscopy of solids.
Spectroscopy
Raman spectroscopy can be used to determine the temperature of a material when other more direct means are either impractical or not possible. The material’s temperature can affect the peak position of Raman bands. When a Raman band shifts significantly with temperature, the monitoring of the peak position can be the most straightforward manner of determining temperature provided the Raman spectrometer has sufficient spectral resolution. Another method is to determine the temperature from the ratio of the Stokes and anti-Stokes signal strengths of a given Raman band. The latter method requires the ability to detect light at wavelengths longer and shorter than that of the laser and an accurate measurement of the wavelength dependent instrument response function.
Spectroscopy E-Books
Spectroscopy E-Books
Spectroscopy E-Books
Spectroscopy
Photoluminescence can provide information about the composition and solid state structure of a material. The high spectral resolution of a Raman spectrometer can be useful in performing photoluminescence spectroscopy of solid state materials, particularly when the emission spectra consist of narrow bands or even lines. Having the capability to perform photoluminescence and Raman spectroscopies simultaneously with the same instrument is advantageous, especially when studying 2D crystals. When used to perform photoluminescence spectroscopy, the Raman spectrometer becomes two instruments in one.
Spectroscopy
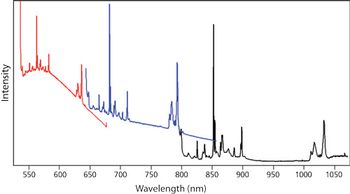
Were it not for the problem of photoluminescence, only one laser excitation wavelength would be necessary to perform Raman spectroscopy. Here, we examine the problem of photoluminescence from the material being analyzed and the substrate on which it is supported. Selecting an excitation wavelength that does not generate photoluminescence reduces the noise level and yields a Raman spectrum with a superior signal-to-noise ratio. Furthermore, we discuss the phenomenon of resonance Raman spectroscopy and the effect that laser excitation wavelength has on the Raman spectrum.
Spectroscopy
The application of vibrational selection rules is usually taught with respect to the vibrational motions of individual molecules. However, many of the materials studied by infrared or Raman spectroscopy are solids and even single crystals. Furthermore, some materials such as covalent or ionic solids have no molecular species associated with them. Consequently, there is a need to understand the application of group theory for the determination of spectroscopically active vibrational modes of crystals. The correlation method is ideal for that purpose.
Spectroscopy
Raman bands in the low energy region of the spectrum of crystals are attributed to so-called external lattice vibrational modes. The Raman bands from these external vibrational modes (low energy phonons) are very sensitive to crystal structure and orientation with respect to the incident laser polarization and to molecular interactions within the crystal. The low energy vibrational modes of many organic molecular crystals have very high Raman scattering cross-sections. Raman spectra and images of low energy phonons in so-called two dimensional (2D) crystals such as few-layer MoS2 reveal spatial variations in the solid state structure that are not evident in the higher energy bands.
Spectroscopy
Resonance and off-resonance Raman spectroscopy and imaging are used to examine the spatial variation of the solid-state structure and electronic character of few-layer MoS2 flakes. Simultaneous acquisition of photoluminescence spectra with the Raman scattering provides complementary ways of rendering Raman and photoluminescence spectral images of thin-film MoS2.
Spectroscopy
Segmented channel waveguides have been fabricated in single-crystal KTiOPO4 through a topotactic process of partial cation exchange. The ion-exchanged waveguides maintain the high nonlinear susceptibility of KTiOPO4 to function as frequency doubling laser light sources
Special Issues
Segmented channel waveguides have been fabricated in single-crystal KTiOPO4 through a topotactic process of partial cation exchange. The ion-exchanged waveguides maintain the high nonlinear susceptibility of KTiOPO4 to function as frequency doubling laser light sources

Spectroscopy
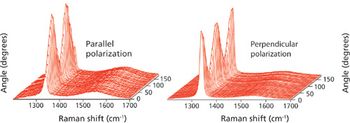
Polarized Raman spectra are presented along with a discussion of the association of the symmetry species of the normal vibrational mode and the depolarization ratio of Raman scattering.
Spectroscopy
What exactly is a "Raman image" and how is it rendered? The authors explain those points, and demonstrate the use of Raman imaging for the characterization of thin-film and ion-implanted silicon structures. High spectral resolution makes it possible to resolve or contrast the substrate silicon and polysilicon film in Raman images and thus aids in the chemical or physical differentiation of spectrally similar materials.
Spectroscopy
Micro-Raman spectroscopy has been used to depth-profile a waveguide produced by an ion-exchange reaction in a single crystal of a ferroelectric metal oxide, and to reveal the changes in chemical bonding and atomic structure that occur in this process.
Special Issues
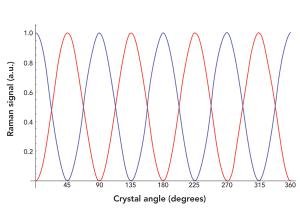
The orientation of a crystal can be determined from the phase shift of the experimental P/O micro-Raman diagram relative to that calculated for a particular crystal face.

September 1st 2021

December 1st 2021

September 1st 2020

September 1st 2013