Article
Application Notebook
Application Notebook
Software Tools for 3D Raman Imaging
Author(s):
Newly developed software tools provide various functions for the acquisition, evaluation, and processing for high-resolution 3D Raman images.
Newly developed software tools provide various functions for the acquisition, evaluation, and processing for high-resolution 3D Raman images. The application note exemplarily describes the basic usage of several software tools.
Confocal Raman microscopy is a high-resolution imaging technique that has become widely used for the characterization of materials and specimens in terms of their chemical composition. With 2D and 3D Raman images, information regarding the chemical compounds and their distribution within the sample can be illustrated clearly. The new WITec Project FOUR software was especially developed to perform large-area and 3D Raman imaging and to ensure an efficient workflow from data acquisition, to evaluation, to post-processing, and then identification of the best results from each measurement.
Generation of Volume Scans, Image Stacks, and 3D Visualization
Volume scans are a valuable tool in providing information about the dimensions of objects or the distribution of a certain compound throughout the sample. The generation of volume scans and 3D images always requires large data sizes. In order to generate 3D images, confocal 2D Raman images of different focal planes are acquired by scanning throughout the sample in the z-direction. The 2D images are then combined into a 3D image stack.

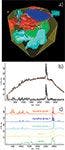

Figure 1: a) 3D color-coded Raman image of pollen in honey. Green: Pollen; Red, Blue, Cyan: Different crystalline phases in the honey; Yellow: Honey. Image parameters: volume size: 50 à 50 à 50 µm3; 150 à 150 à 50 = 1,125,000 spectra; integration time per spectrum: 12.2 ms. b) Example spectrum before and after background subtraction: With the automatic background subtraction varying background signals from large data sets can be automatically identified (red line) and removed. c) Corresponding Raman spectra after background subtraction.
A sample of natural honey was investigated. For the 3D image, 50 single 2D Raman images (x-y scan) were generated from different z-positions through the sample. The scan range was 50 × 50 µm2 with 150 × 150 pixels. The raw data file size was about 2.1 GB. In a first processing step the main sample components were identified by the cluster analysis function of the Project FOUR software. Since biological samples tend to show a strong fluorescence background signal, an automatic background subtraction filter was additionally applied in order to remove varying background signal from the data set (Figure 1b). The background subtracted spectra of the main components are shown in Figure 1c. The data were further processed and optimized for 3D visualization by applying the basis analysis algorithm for spectral demixing. The resulting signal intensity values were used to generate the 3D image stack with a third party software. The color-coded 3D stack has a volume of 50 × 50 × 50 µm3 and displays a pollen shown in green surrounded by different crystalline phases of the honey in red, blue, and cyan and the liquid honey phase displayed in yellow (Figure 1a).
WITec GmbH
Lise-Meitner-Str. 6, 89091 Ulm, Germany
tel. +49 (0) 731 140 700, email: info@witec.de
Website: www.witec.de


Newsletter
Get essential updates on the latest spectroscopy technologies, regulatory standards, and best practices—subscribe today to Spectroscopy.


