Detection of Acute Kidney Injury Induced by Gentamicin in a Rat Model by Aluminum-Foil-Assisted ATR-FT-IR Spectroscopy
Fourier transform infrared (FT-IR) spectroscopy has attracted great attention in the field of disease diagnostics for many years. Yet, the clinical translation of FT-IR spectroscopy has been rather slow because of several bottlenecks. This work explores the potential of aluminum foil-assisted attenuated total reflectance-FT-IR (ATR-FT-IR) spectroscopy, which is a simple and economical FT-IR sampling technique, to detect acute kidney injury (AKI) induced by gentamicin in a rat model. It was found that partial least squares-discriminant analysis (PLS-DA) could successfully discriminate between the AKI status and the healthy status with the plasma samples of the rats. An in-depth discussion on the advantages of aluminum-foil-assisted ATR-FT-IR spectroscopy in FT-IR-based disease diagnostics is also provided.
Fourier transform infrared (FT-IR) spectroscopy is a rapid, non-invasive, and label-free analytical technology and has attracted great attention in the field of disease diagnostics for many years (1–6). As a vibrational spectroscopic tool, FT-IR spectroscopy has the capability to detect the vibrations of all molecules, such as proteins, nucleic acids, lipids, and carbohydrates in a clinical specimen. Thus, FT-IR spectroscopy can provide a comprehensive omnic picture of the tested sample. Owing to its sensitivity to the compositional and structural changes inside the clinical specimen,
FT-IR-based diagnostics can provide a spectral biomarker for diseases. The spectral biomarker can be a single spectral band or multiple spectral bands demonstrating the disease characteristics, or the whole spectral fingerprint can be used to discriminate the different health status when enabled using chemometric analysis.
To date, FT-IR-based diagnostics has been applied to a variety of clinical samples, including tissues (7–9), plasma and serum (10–16), and body fluids (17–20). Many proof-of-principle studies have clearly demonstrated the potential of FT-IR-based diagnostics for human diseases in clinical translation. Some startup companies aiming at translation to clinical applications were also established (2).
Aluminum-foil-assisted ATR-FT-IR spectroscopy was an FT-IR sampling approach developed by Martin and coworkers in 2016 (21). When implementing this approach, kitchen-grade aluminum foil may be used as the solid substrate for sample deposition. After a simple drying step, the deposited sample is pressed against the ATR crystal for FT-IR measurement. This sampling approach avoids the direct use of the ATR crystal or other expensive substrates for sample deposition during ATR-FT-IR measurement. It could significantly reduce the sampling cost and simplify the sampling procedure in clinical applications. The aluminum-foil-assisted ATR-FT-IR approach has now emerged as an attractive sampling approach for FT-IR-based disease diagnostics (20, 22–25). For example, one demonstration was performed very recently by Nascimento et al. where they used this approach to detect Covid-19 within saliva samples. By combining chemometric analysis with the spectra, they reported reasonable accuracy and sensitivity for Covid-19 diagnostics (20). This work aims to further tackle the potential of the aluminum-foil-assisted ATR-FT-IR approach in disease diagnostics by using this technique to detect acute kidney injury (AKI) status induced by gentamicin in a rat model. We hope that this exploratory work is beneficial for the future development of FT-IR-based disease diagnostics.
Materials and Methods
AKI Rat Model Induced by Gentamicin
Male Wister rats (240±20 g, N = 3) were purchased from Vital River Lab Animal Technology Co., Ltd (Beijing, China). The rats were housed with free access to food and water under constant temperature, humidity, and lighting (12 h light per day). The animal experiment was carried out strictly according to the ethics guidelines for the care and use of laboratory animals approved by the Animal Ethics Committee of Tianjin Tasly Institute, Tianjin, China. The rats were dosed with gentamicin (160 mg/kg) in saline to establish an AKI rat model. The dose of gentamicin used in this work was referred to as that used in a previous publication (26,27). These rats were injected with gentamicin for three consecutive days; that is, on day one, day two, and day three. The gentamicin sulfate injection solution was obtained from CSPC Pharmaceutical Group Co., Ltd. (Shijiazhuang, China). Sodium chloride (NaCl) was in analytical grade and ordered from a local vendor.
Sample Preparations for ATR-FT-IR Measurements
The whole blood samples from the rats were collected through retro-orbital blood sampling. The samples taken on day one before gentamicin injections were from the healthy rats, and they were used as the control group in the chemometric analysis of plasma samples; the samples taken on day two and day three before gentamicin injections and on day four were from the rats affected by gentamicin (from the AKI rats), and they were used as the AKI group in the chemometric analysis of plasma samples. The whole blood sample was centrifuged at 3000 r/min for 10 min and the supernatant plasma was collected and stored at -80 °C for future ATR-FT-IR investigation. To prepare the plasma sample for aluminum-foil-assisted ATR-FT-IR measurement, a large piece of kitchen-grade aluminum foil was cleaned with alcohol and water and then air-dried. The large piece of aluminum foil was cut into small pieces with a size of 1 x 1 cm. The plasma sample was first thawed under ambient conditions and 10 µL of the sample was pipetted onto the small piece of aluminum foil. The aluminum foil with sample deposit was placed in an oven at 37 °C for 2 hr. The sample formed a dry film on the surface of the aluminum foil. The dry plasma sample film was used for ATR-FT-IR measurement.
Aluminum-Foil-Assisted ATR-FT-IR Measurement
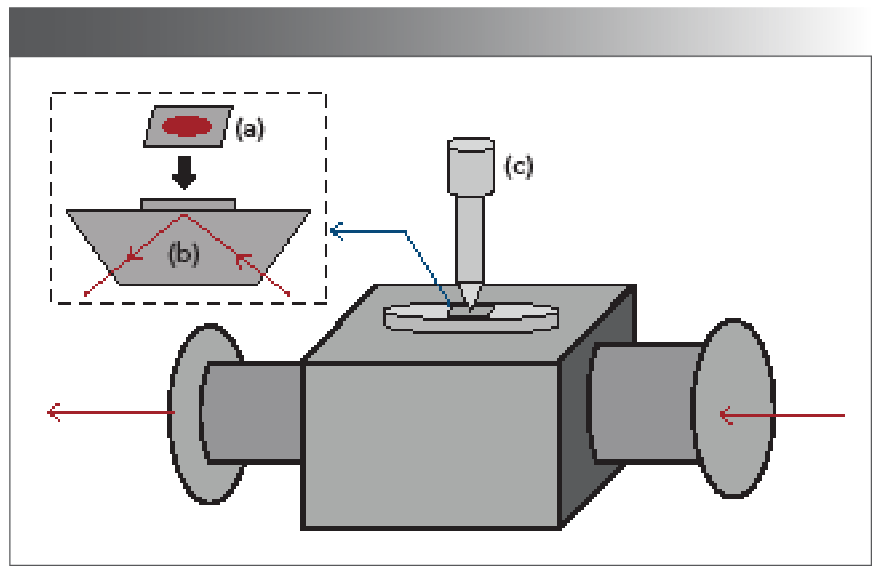
The details of aluminum-foil-assisted ATR-FT-IR measurement are shown in Figure 1 Measurements were made using a Bruker Vertex 70 FT-IR spectrometer (Ettlingen, Germany) equipped with a DLaTGS detector. A Pike Technologies single-reflection ATR sampling accessory (Madison, Wisconsin) was employed. This ATR sampling accessory contained a diamond ATR crystal. As shown in Figure 1, when performing the measurement, the surface of aluminum foil having plasma deposition was pressed against the ATR diamond crystal surface with a manual pressure clamp from Pike Technologies. The high-pressure of the pressing device would ensure a close contact between the sample and the diamond crystal. For the FT-IR measurements, 4 cm-1 resolution and 32 scans were chosen. In this work, each plasma sample was used to prepare five replicate samples on five different pieces of aluminum foil. For each piece of aluminum foil sample, 12 FT-IR spectra were taken by sampling at different points on the foil. The total number of the collected FT-IR spectra for each group (that is, the control group or the AKI group) is approximately 180.

 aluminum foil with sample deposition, (b) ATR element, and (c) pressure device.")
FIGURE 1: Schematic illustration of aluminum-foil-assisted ATR-FT-IR set-up. (a) aluminum foil with sample deposition, (b) ATR element, and (c) pressure device.
Chemometric Analysis
Partial least squares discriminant analysis (PLS-DA) was performed using Unscrambler software (version 10.5) (Camo Analytics). The second derivative FT-IR spectra in the 1750–900 cm-1 region were used for chemometric analysis. Before chemometric analysis, the raw absorption spectra were subjected to data pre-treatments including smoothing and normalization.
Results
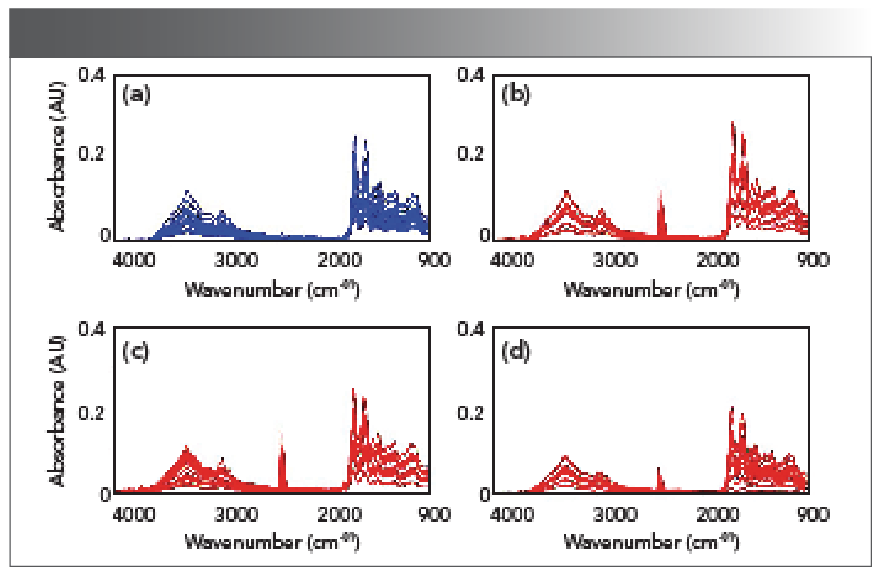
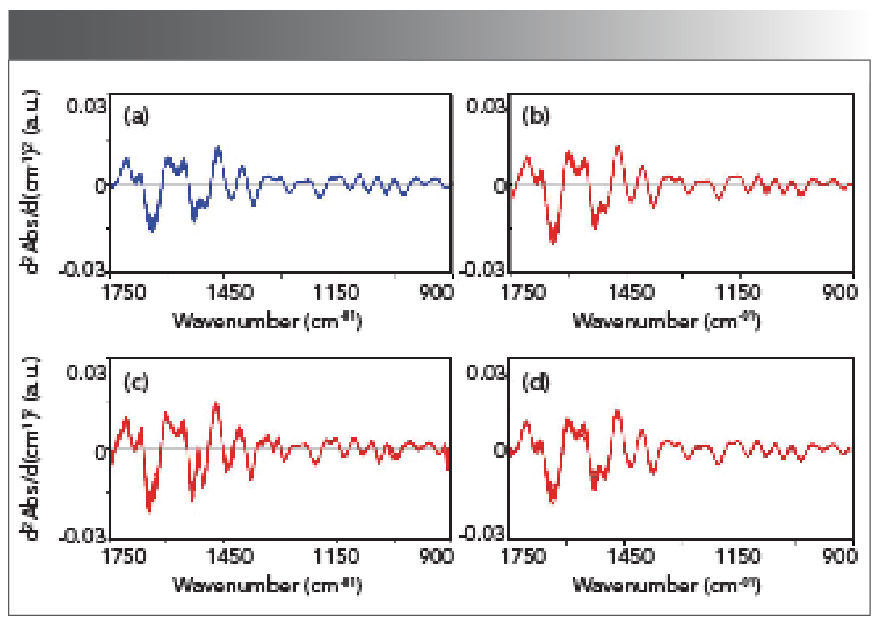
The aim of this work was to examine whether the aluminum-foil-assisted ATR-FT-IR spectroscopy could differentiate the rats in the AKI group from the rats in the control group. The FT-IR spectra in the spectral region of 4000–900 cm-1 of the plasma samples of the rats in the control group (blue color) and in the AKI group (red color) collected at different time points were shown in Figure 2. Figure 2a is the spectral set from the control group; Figure 2b is the spectral set from the AKI group at day 2; Figure 2c is the spectral set from the AKI group at day 3; and Figure 2d is the spectral set from the AKI group at day 4. Figure 3 shows the absorption spectra from Figure 2 that were further processed using second derivative treatment. In Figure 3, only the spectral region of 1750–900 cm-1 is displayed, and the data set in this spectral region was used in the following chemometric analysis. This spectral region corresponds to the FT-IR fingerprint region, which should contain useful information regarding the biochemical changes because of gentamicin-induced AKI.

 control group, (b) AKI group at day 2, (c) AKI group at day 3, and (d) AKI group at day 4.")
FIGURE 2: ATR-FT-IR absorption spectra in the spectral region of 4000-900 cm-1 of the plasma samples of the rats in the control group and in the AKI group. (a) control group, (b) AKI group at day 2, (c) AKI group at day 3, and (d) AKI group at day 4.

 control group, (b) AKI group at day 2, (c) AKI group at day 3, and (d) AKI group at day 4.")
FIGURE 3: FT-IR second derivative spectra in the spectral region of 1750–900 cm-1 of the plasma samples of the rats in the control group and in the AKI group. (a) control group, (b) AKI group at day 2, (c) AKI group at day 3, and (d) AKI group at day 4.
In the following discussion, PLS-DA will be explored to distinguish the plasma samples from the AKI group and the plasma samples from the control group. PLS-DA is a widely used classification approach in chemometrics. It is a discrimination method based on PLS regression and has demonstrated great successes in many fields such as disease diagnostics and product authentication analysis (28,29).
Figure 4a shows the PLS-DA analysis results for the processed spectra displayed in Figures 3a and 3b. This will let us look into the discriminant capability of PLS-DA for the rats in the control group and the rats in the AKI group at day two. The PLS-DA chemometric analysis was implemented in the following way. The spectra presented in Figures 3a and 3b were used to form six data sets. Three data sets belong to the three rats in the control group and the other three data sets belong to the three rats in the AKI group. These data sets were first used to construct the classification model which is presented as the blue data points in Figure 4a. In Figure 4a, the green data points represent the reference values, and the reference values of one correspond to the rats in the AKI status and the reference values of zero correspond to the rat in the health status. For a successful classification using PLS-DA, if a rat is in the AKI status, the predicted value would lie between 0.5 and 1; if a rat is in a healthy status, the predicted value would lie between 0 and 0.5. As we can see from Figure 4a, the two rat groups were indeed accurately classified with this PLS-DA model. The obtained R2 value was 0.9650 and the RMSE value was 0.093, indicating a successful PLS-DA model. Furthermore, a cross validation was performed on the six data sets. For cross validation, each data set was used once as a test set while the remaining data sets formed the training set. The cross validation results, presented as red data points (dots) in Figure 4a, also supported a successful PLS-DA classification. The obtained R2 value was 0.9370 and the RMSE was 0.1500. Therefore, our results in Figure 3a indicated that PLS-DA could successfully differentiate the rats in the AKI status from the rats in the healthy status using the plasma samples at day 2.

 Day 2, (b) Day 3, and (c) Day 4. Green dots: reference values; Blue dots: predicted; Red dots: cross validation.")
FIGURE 4: PLS-DA plot for the FT-IR spectra in the spectral region of 1750-900 cm-1 for the plasma samples at (a) Day 2, (b) Day 3, and (c) Day 4. Green dots: reference values; Blue dots: predicted; Red dots: cross validation.
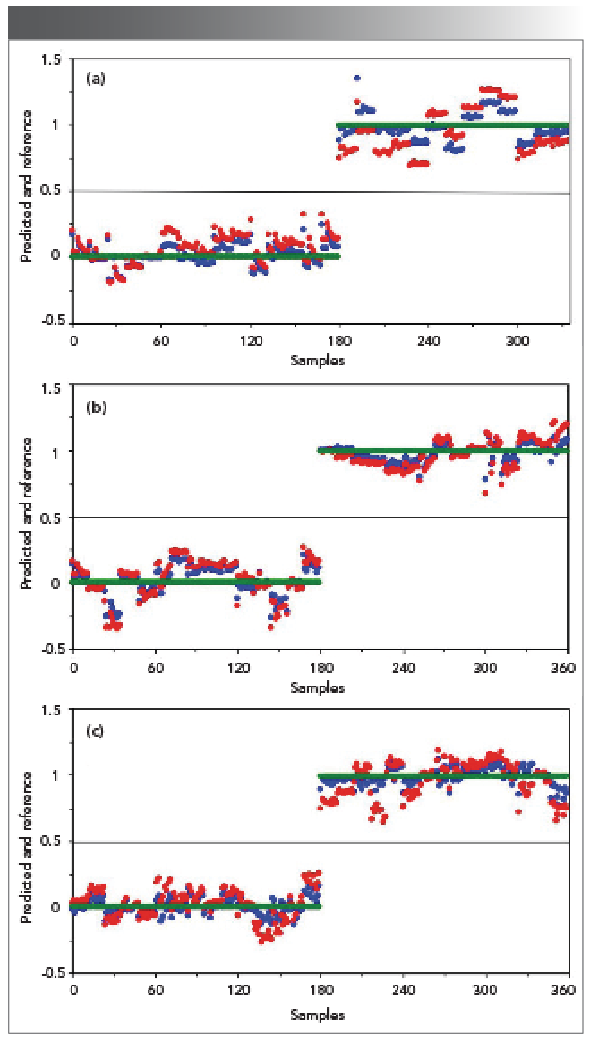
Similarly, the PLS-DA analysis was performed on the spectra in Figure 3a and Figure 3c corresponding to the rats in the control group and the rats in the AKI group at day 3. As we can see from Figure 4b, the samples could again be accurately classified with this PLS-DA model (refer to the blue data points). The obtained R2 value was 0.9670 and the RMSE value was 0.0909, indicating a successful PLS-DA model. The cross validation results (refer to the red data points) also supported that this PLS-DA model performed well. The obtained R2 value was 0.9389 and the RMSE was 0.1279. Therefore, our results indicated that PLS-DA model could successfully differentiate the rats in the AKI status from the rats in the healthy status using the plasma samples at day three. Furthermore, the PLS-DA analysis was performed on the spectra in Figures 3a and 3d corresponding to the rats in the control group and the rats in the AKI status at day four. As we can see from Figure 4c, the samples could be accurately classified with this PLS-DA model (refer to the blue data points). The obtained R2 value reached 0.9846 and the RMSE value reached 0.0620, indicating a successful PLS-DA model. The cross validation results (refer to the red data points) also supported that this PLS-DA model performed well. The obtained R2 value reached 0.9388 and the RMSE reached 0.1274. Therefore, our results indicated that PLS-DA model could also successfully differentiate the rats in the AKI status from the rats in the healthy status using the plasma samples at day four.
Before concluding this exploratory work, we would like to have an in-depth discussion on the current bottlenecks that hinder the clinical translation of FT-IR-based disease diagnostics and the clinical potential of the aluminum-foil-assisted ATR-FT-IR spectroscopy explored here. As we know, there are numerous works published previously aiming to use FT-IR spectroscopy to perform disease diagnosis. Yet, the clinical translation of FT-IR spectroscopy is rather slow (2). There are only a few start-ups that are committed to promoting this technology. For example, Glyconics, a company established in Cambridge University, is committed to using infrared spectroscopy to diagnose COPD, and Clinspec Diagnostics, a company established in Strathclyde, uses infrared spectroscopy to diagnose brain cancer (2). Despite these progresses, the clinical applications of FT-IR-based disease diagnostics still face some serious challenges. In particular, we think the current sampling approaches widely used in FT-IR-based disease diagnostics are the number-one obstacle, and there are several issues. First, if we take an FT-IR spectrum of a clinical sample in transmission mode, an expensive and fragile infrared window is needed. Even using a less expensive low-emissivity (low-E) glass as an alternative, large-scale consumption of low-E glass is still a huge burden when facing a large amount of clinical samples. This situation significantly increases the cost of FT-IR-based disease diagnostics in a clinical setting. Second, when using a typical ATR-FT-IR approach, the clinical samples can only be deposited on the ATR crystal one-by-one right before the FT-IR measurement and cannot be prepared in advance. Third, although the FT-IR microscope has showed great promises in many pilot studies in disease diagnostics, it is also very expensive and the maintenance and operation of a FT-IR microscopes requires experienced personnel. This situation makes FT-IR microscopes not a user-friendly choice in a clinical setting. Yet, all of these obstacles are no longer an issue if the aluminum-foil-assisted ATR-FT-IR spectroscopy can be transformed to the clinic. The proposed ATR-FT-IR method is apparently very cost-effective and user friendly. This approach only needs a common FT-IR spectrometer with an ATR accessory. Currently, the price of such type of FT-IR instrumentation can be as low as $20,000 on the market. This approach only needs extremely cheap kitchen-grade aluminum foil as the substrate for sample deposition and substrate cost is thus negligible compared with using IR window or low-E glass as substrates. The protocols for sample preparation and spectral acquisition can be easily mastered by any clinician. In this exploratory work, we have showed the potential of this advantageous ATR-FT-IR sampling technique in AKI diagnostics in a rat model. We hope that more clinical samples can be explored using aluminum-foil-assisted ATR-FT-IR spectroscopy in the future. If successful, we believe that aluminum-foil-assisted ATR-FT-IR spectroscopy would greatly promote the clinical translation of FT-IR-based disease diagnostics.
Conclusion
In this exploratory study, aluminum foil-assisted ATR-FT-IR spectroscopy was used to detect AKI in a rat model using the plasma samples. The results showed that PLS-DA technique could effectively distinguish between the AKI status and the healthy status using the FT-IR spectral data. This exploratory work demonstrated the potential of aluminum foil-assisted ATR-FT-IR spectroscopy in the detection of AKI. We also provided an in-depth discussion on the clinical translation potential of aluminum-foil-assisted ATR-FT-IR spectroscopy.
Acknowledgments
We gratefully acknowledge the financial support from the National Natural Science Foundation of China (No. 21973024). We thank Dr. Xiangke Chen for
useful discussions.
Conflicts of Interest
There are no conflicts to declare.
References
(1) Baker, M. J.; Trevisan, J.; Bassan, P.; et al. Using Fourier Transform IR Spectroscopy to Analyze Biological Materials. Nat. Protoc. 2014, 9 (8), 1771–1791. DOI: 10.1038/nprot.2014.110
(2) Finlayson, D.; Rinaldi, C.; Baker, M. J. Is Infrared Spectroscopy Ready for the Clinic? Anal. Chem. 2019, 91 (19), 12117–12128. DOI: 10.1021/acs.analchem.9b02280
(3) Callery, E. L.; Rowbottom, A. W. Vibrational Spectroscopy and Multivariate Analysis Techniques in the Clinical Immunology Laboratory: A Review of Current Applications and Requirements for Diagnostic Use. Appl. Spectrosc. Rev. 2022, 57 (5), 411–440. DOI: 10.1080/05704928.2021.1958337
(4) Paraskevaidi, M.; Matthew, B. J.; Holly, B. J.; et al. Clinical Applications of Infrared and Raman Spectroscopy in the Fields of Cancer and Infectious Diseases. Appl. Spectrosc. Rev. 2021, 56 (8–10), 804–868. DOI: 10.1080/05704928.2021.1946076
(5) Naseer, K.; Ali, S.; Qazi, J. ATR-FTIR Spectroscopy as the Future of Diagnostics: A Systematic Review of the Approach Using Bio-Fluids. Appl. Spectrosc. Rev. 2021, 56 (2), 85–97. DOI: 10.1080/05704928.2020.1738453
(6) Magalhaes, S.; Goodfellow, B. J.; Nunes, A. FTIR Spectroscopy in Biomedical Research: How to Get the Most out of Its Potential. Appl. Spectrosc. Rev. 2021, 56 (8–10), 869–907. DOI: 10.1080/05704928.2021.1946822
(7) Pilling, M.; Gardner, P. Fundamental Developments in Infrared Spectroscopic Imaging for Biomedical Applications. Chem. Soc. Rev. 2016, 45 (7), 1935–1957. DOI: 10.1039/c5cs00846h
(8) Grzelak, M. M.; Wrobel, P. M.; Lankosz, M.; et al. Diagnosis of Ovarian Tumour Tissues by SR-FTIR Spectroscopy: A Pilot Study. Spectrochim. Acta Part A Mol. Biomol. Spectrosc. 2018, 203, 48–55. DOI: 10.1016/j.saa.2018.05.070
(9) Li, L.; Bi, X.; Sun, H.; et al. Characterization of Ovarian Cancer Cells an Tissues by Fourier Transform Infrared Spectroscopy. J. Ovarian Res. 2018, 11, 64. DOI: 10.1186/s13048-018-0434-8
(10) Baker, M. J.; Hussain, S. R.; Lovergne, L.; et al. Developing and Understanding Biofluid Vibrational Spectroscopy: A Critical Review. Chem. Soc. Rev. 2016, 45 (7), 1803–1818. DOI: 10.1039/c5cs00585j
(11) Barlev, E.; Zelig, U.; Bar, O.; et al. A Novel Method for Screening Colorectal Cancer by Infrared Spectroscopy of Peripheral Blood Mononuclear Cells and Plasma. J. Gastroenterol. 2016, 51 (3), 214–221. DOI: 10.1007/s00535-015-1095-7
(12) Lovergne, L.; Bouzy, P.; Untereiner, V.; et al. Biofluid Infrared Spectro-Diagnostics: Pre-Analytical Considerations for Clinical Applications. Faraday Discuss. 2016, 187, 521–537. DOI: 10.1039/c5fd00184f
(13) Paraskevaidi, M.; Morais, C. L. M.; Freitas, D. L. D.; et al. Blood-Based Near-Infrared Spectroscopy for the Rapid Low-Cost Detection of Alzheimer’s Disease. Analyst 2018, 143 (24), 5959–5964. DOI: 10.1039/c8an01205a
(14) Elmi, F.; Movaghar, A. F.; Elmi, M. M.; et al. Application of FT-IR Spectroscopy on Breast Cancer Serum Analysis. Spectrochim. Acta Part A Mol. Biomol. Spectrosc. 2017, 187, 87–91. DOI: 10.1016/j.saa.2017.06.021
(15) Peters, A. S.; Backhaus, J.; Pfuetzner, A.; et al. Serum-Infrared Spectroscopy Is Suitable for Diagnosis of Atherosclerosis and Its Clinical Manifestations. Vib. Spectrosc. 2017, 92, 20–26. DOI: 10.1016/j.vibspec.2017.04.009
(16) Titus, J.; Viennois, E.; Merlin, D.; et al. Minimally Invasive Screening for Colitis Using Attenuated Total Internal Reflectance Fourier Transform Infrared Spectroscopy. J. Biophotonics 2017, 10 (3), 465–472. DOI: 10.1002/jbio.201600041
(17) Yu, M.-C.; Rich, P.; Foreman, L.; et al. Label Free Detection of Sensitive Mid-Infrared Biomarkers of Glomerulonephritis in Urine Using Fourier Transform Infrared Spectroscopy. Sci. Rep. 2017, 7, 4601. DOI: 10.1038/s41598-017-04774-7
(18) Yonar, D.; Ocek, L.; Tiftikcioglu, B. I.; et al. Relapsing-Remitting Multiple Sclerosis Diagnosis from Cerebrospinal Fluids Via Fourier Transform Infrared Spectroscopy Coupled with Multivariate Analysis. Sci. Rep. 2018, 8, 1025. DOI: 10.1038/s41598-018-19303-3
(19) Barauna, V. G.; Singh, M. N.; Barbosa, L. L.; et al. Ultrarapid on-Site Detection of Sars-Cov-2 Infection Using Simple ATR-FTIR Spectroscopy and an Analysis Algorithm: High Sensitivity and Specificity. Anal. Chem. 2021, 93 (5), 2950–2958. DOI: 10.1021/acs.analchem.0c04608
(20) Nascimento, M. H. C.; Marcarini, W. D.; Folli, G. S.; et al. Noninvasive Diagnostic for Covid-19 from Saliva Biofluid via FTIR Spectroscopy and Multivariate Analysis. Anal. Chem. 2022, 94 (5), 2425–2433. DOI: 10.1021/acs.analchem.1c04162
(21) Cui, L.; Butler, H. J.; Martin-Hirsch, P. L.; et al. Aluminium Foil as a Potential Substrate for ATR-FTIR, Transflection FTIR or Raman Spectrochemical Analysis of Biological Specimens. Anal. Methods 2016, 8 (3), 481–487. DOI: 10.1039/c5ay02638e
(22) Paraskevaidi, M.; Morais, C. L. M.; Raglan, O.; et al. Aluminium Foil as an Alternative Substrate for the Spectroscopic Interrogation of Endometrial Cancer. J. Biophotonics 2018, 11 (7), e201700372. DOI: 10.1002/jbio.201700372
(23) Tian, W. L.; Wang, D.; Fan, H. R.; et al. A Plasma Biochemical Analysis of Acute Lead Poisoning in a Rat Model by Chemometrics-Based Fourier Transform Infrared Spectroscopy: An Exploratory Study. Front. Chem. 2018, 6, 261. DOI: 10.3389/fchem.2018.00261
(24) Li, C.; Fan, H.; Sun, Y.; et al. Toxicity of Aristolochic Acid in a Rat Model Investigated by Fourier Transform Infrared Spectroscopy Combined with Chemometric Analysis: An Exploratory Study. Vib. Spectrosc. 2021, 117, 103307. DOI: 10.1016/j.vibspec.2021.103307
(25) Kochan, K.; Bedolla, D. E.; Perez-Guaita, D.; et al. Infrared Spectroscopy of Blood. Appl. Spectrosc. 2021, 75 (6), 611–646. DOI: 10.1177/0003702820985856
(26) El-Kashef, D. H.; El-Kenawi, A. E.; Suddek, G. M.; et al. Protective Effect of Allicin against Gentamicin-Induced Nephrotoxicity in Rats. Int. Immunopharmacol. 2015, 29 (2), 679–686. DOI: 10.1016/j.intimp.2015.09.010
(27) Luo, Q. H.; Chen, M. L.; Chen, Z. L.; et al. Evaluation of Kim-1 and Ngal as Early Indicators for Assessment of Gentamycin-Induced Nephrotoxicity in Vivo and in Vitro. Kidney Blood Press. Res. 2016, 41 (6), 911–918. DOI: 10.1159/000452592
(28) Gromski, P. S.; Muhamadali, H.; Ellis, D. I.; et al. A Tutorial Review: Metabolomics and Partial Least Squares-Discriminant Analysis – a Marriage of Convenience or a Shotgun Wedding? Anal. Chim. Acta 2015, 879, 10–23. DOI: 10.1016/j.aca.2015.02.012
(29) Lee, L. C.; Liong, C.-Y.; Jemain, A. A. Partial Least Squares-Discriminant Analysis (PLS-DA) for Classification of High-Dimensional (HD) Data: A Review of Contemporary Practice Strategies and Knowledge Gaps. Analyst 2018, 143 (15), 3526–3539. DOI: 10.1039/C8AN00599K
Lujuan Yang, Haoran Fan, Peng Shang, Ying Sun, Wenli Tian, and Gang Ma are with the Key Laboratory of Medicinal Chemistry and Molecular Diagnosis of Ministry of Education, and the Key Laboratory of Analytical Science and Technology of Hebei Province, College of Chemistry and Materials Science, at Hebei University, in Baoding, China. Tian is also with Immune-Path Biotechnology (Suzhou) Co., Ltd., in Suzhou, China. Direct correspondence to: Gang Ma at gangma@hbu.edu.cn, Ying Sun at mayusun@gmail.com, or Wenli Tian at tianwenli@immune-path.com ●


Polystyrene and UVC Sterilization Tested with Spectroscopy and Luminescence Tools
June 25th 2025A team of researchers from Spanish institutions has found that polystyrene used in healthcare packaging shows strong resistance to UVC sterilization, with minimal chemical degradation detected using FT-IR and Raman spectroscopy.

