Article
Spectroscopy
Spectroscopy
Why Are the Raman Spectra of Crystalline and Amorphous Solids Different?
Author(s):
The Raman spectra of crystalline and amorphous solids of the same chemical composition can be significantly different primarily because of the presence or absence of spatial order and long range translational symmetry, respectively. The purpose or goal of this installment of Molecular Spectroscopy Workbench is to help readers understand the underlying physics that affect the Raman spectra of crystalline and amorphous solids. Wave vector, reciprocal space, and the Brillouin zone are explained with respect to Raman spectroscopy of solids.
The Raman spectra of crystalline and amorphous solids of the same chemical composition can be significantly different primarily because of the presence or absence of spatial order and longrange translational symmetry, respectively. The purpose or goal of this installment of “Molecular Spectroscopy Workbench” is to help readers understand the underlying physics that affect the Raman spectra of crystalline and amorphous solids. Wave vector, reciprocal space, and the Brillouin zone are explained with respect to Raman spectroscopy of solids.
If you are a chemist, you most likely learned vibrational spectroscopy as molecular spectroscopy. That is, you learned about the normal vibrational modes of discrete molecules-as opposed to solid-state materials-and their Raman or infrared activity based upon molecular spectroscopic selection rules. Raman spectra of compounds in the liquid, or vapor, phase consist of narrow bands whose widths depend upon the degree of chemical interaction between the molecules. The weaker the chemical interaction, the narrower the band will be. In fact, the bands of a compound in the vapor phase will be narrower than those of the same compound in the liquid phase for that very reason (1). The broad infrared absorption and Raman bands of water demonstrate the effect of hydrogen bonding and the result of different degrees of chemical interaction between the molecules in a neat liquid. The breadth of the O-H stretching modes in particular is a manifestation of the distribution of vibrational energy states as a result of these many and different chemical interactions.
Interpreting the Raman spectra of compounds, or materials in the solid state, requires the knowledge of concepts and mathematical treatments other than those of molecular spectroscopy. The Raman spectra of crystalline and amorphous solids of the same chemical composition can be significantly different, primarily because of the presence or absence of spatial order and long-range translational symmetry, respectively. Amorphous solids can be thought of as a collection of formula units of the same chemical composition, but with varying bond angles and lengths depending upon chemical bond interactions with nearest neighbors. There is no order to their arrangement in space. Consequently, one does not observe the narrow bands familiar to us in molecular spectroscopy from amorphous solids. The distribution of formula units with varying bond angles and lengths produces a distribution of states of slightly varying vibrational energies. It may be helpful to think of this distribution of atomic and chemical bonding arrangements in the amorphous solid as analogous to the distribution of vibrational energy states in liquid water because of the presence of hydrogen bonding.
The spectroscopic selection rules for solid-state and molecular spectroscopy require making some important distinctions regarding symmetry. The number of Raman and infrared active modes of a crystal depends upon the space group symmetry of the crystal whereas the spectroscopically active vibrational modes of a molecule are determined by its point group. The existence of a crystal lattice of repeating unit cells allows the propagation of lattice vibrational waves (also called phonons) that originate in the repetitive and systematic vibrational motions of the crystal’s atoms whereas the vibrational modes of molecules are local and not coupled to those of neighboring molecules. It is the launching of a lattice vibrational wave or phonon by the incident photon that leads to the scattering of a Raman photon by the crystal. We define a phonon as a lattice vibrational wave propagating through the crystal arising from repetitive atomic displacements. Furthermore, the phonon has the characteristics of a traveling wave insofar as it has a propagation velocity, wavelength, wave vector, and frequency.
Structurally, crystals differ from amorphous solids and glasses in that the former possess long-range translational symmetry whereas the latter lack any spatial order. The Raman spectra obtained from quartz (crystalline and fused) and a glass microscope slide (See Figure 1) very clearly demonstrate the importance of spatial order. The quartz samples are of the same chemical composition but one is crystalline whereas the fused quartz is a glass with no long-range translational symmetry. The Raman spectrum of crystalline quartz consists of sharp and mostly narrow bands whereas that of the fused quartz manifests very broad peaks with widths of up to several hundred wavenumbers. One might incorrectly conclude from the spectra that the chemical compositions of these two solids were different. However, they are not and it is only their solid-state structures that differ, thereby producing the dramatic differences in the spectra. The chemical composition of the microscope slide is different from that of quartz, but like the fused quartz it has a glass solid-state structure with no long-range translational symmetry. Consequently, its Raman spectrum is similar to that of the fused quartz insofar as it consists of very broad bands.

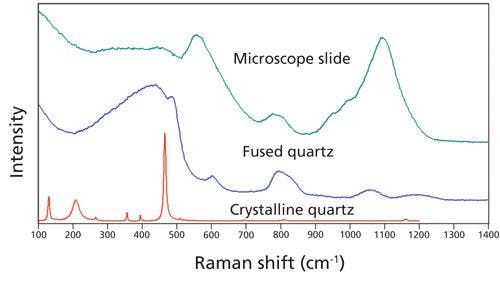
Figure 1: Raman spectra of crystalline and fused quartz and a glass microscope slide.

Amorphicity can be induced in crystalline solids through ion bombardment, which is also known as ion implantation when used in semiconductor fabrication. Dopants are placed at specific depths in semiconductors through the process of ion implantation by carefully controlling the dopant flux and impact energy. Atoms are dislodged from their positions in the host crystal lattice as a result of this ion bombardment. Consequently, the semiconductor’s crystal lattice is broken and the long-range translational symmetry is disrupted. The extent of damage to the crystal lattice is determined by the mass, energy, and flux of the dopant being implanted; for example, a heavier dopant mass and higher flux will induce greater damage to the crystal lattice. The semiconductor must be annealed following ion implantation because of the damage done to the crystal lattice. The heat treatment restores crystallinity and thereby activates the semiconductor device.
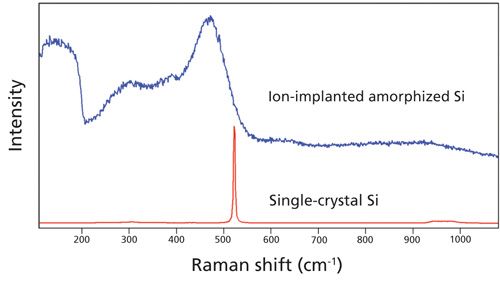
Raman spectra of single crystal and ion-implanted Si obtained from different locations on the same sample are shown in Figure 2. The Raman spectrum of single-crystal Si consists of one triply degenerate optical phonon at 520 cm-1 along with much weaker second-order transverse acoustic and optical modes that appear at approximately 305 cm-1 and 975 cm-1, respectively. The selection rules for first-order Raman scattering from crystalline solids dictate that only those optical phonons at the Brillouin zone center are Raman active. (We explain this rule later in this article.) Consequently, the first-order Raman band at 520 cm-1 is very narrow with a full width at half maximum of only 4 cm-1. This particular Si sample was implanted with a high dose of arsenic, a much heavier element than the other common dopants boron or phosphorus, and so the crystalline lattice within the first several hundred nanometers of the surface has been severely damaged and amorphized. The Raman spectrum of the arsenic-implanted Si consists of very broad bands below 550 cm-1. The reason for the detection of Raman scattering over this broad region is that the Raman selection rule for crystals restricting Raman scattering to phonons at the Brillouin zone center no longer holds in amorphous Si and all of the phonons from Brillouin zone center to edge are now sampled. The Raman spectrum of amorphous Si looks very much like the calculated populations of phonon energy states within the first Brillouin zone of crystalline Si.


Figure 2: Raman spectra of Si amorphized through ion implantation and single-crystal Si.
The purpose and goal of this installment of “Molecular Spectroscopy Workbench” is to help readers understand the underlying physics that produce such different Raman spectra in crystalline and amorphous solids. We need to understand concepts such as wave vector, reciprocal space, and the Brillouin zone to accomplish that goal. Therefore, we will explain each of these topics and finally bring them all together, leading to the conclusion that in a crystal only those phonons at the Brillouin zone center are Raman active. With the loss of long-range translational symmetry in an amorphous solid, the Raman selection rules for crystalline solids no longer hold. Consequently, all of the phonons of the Brillouin zone become Raman active and the Raman spectrum of the amorphous solid resembles the phonon density of states of the corresponding crystal’s phonon dispersion curve. If after reading this article you would like to view a detailed lecture on this topic, please see the companion video on YouTube (2).
Phonons and Reciprocal Space in a One-Dimensional Lattice
Earlier, we defined a phonon as a lattice vibrational wave propagating through the crystal arising from repetitive and systematic atomic displacements. It should also be understood that these displacements are quantized vibrations of the atoms in the lattice and are traveling waves. The phonon has the characteristics of a traveling wave insofar as it has a propagation velocity, wavelength, wave vector, and frequency. It is important to note that all of the peaks in a Raman spectrum of a crystalline solid are attributed to phonons and not only those at low energy or Raman shift. P.M.A. Sherwood makes that point abundantly clear in his fine book, Vibrational Spectroscopy of Solids: “All crystal vibrations involve the entire lattice and are thus lattice vibrations (a term sometimes unfortunately only applied to external vibrations) and such vibrations can be considered as a wave propagating through the crystal lattice” (3). Unlike the normal vibrational mode of an individual molecule, a phonon is a lattice vibrational wave traveling through the crystal. This is why a mathematical treatment of the vibrational motions of the crystal’s atoms must take into account the medium through which the phonon is propagating.
We describe the phonon as a traveling wave with one of its characteristics, the wave vector k, defined as

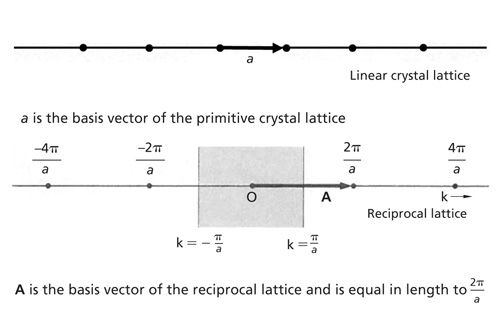
where λ is the phonon wavelength. The wave vector is in units of wavenumbers (cm-1) because the phonon wavelength is in the denominator. Perhaps you can anticipate why a reciprocal lattice with units of distance in the denominator (for example, cm-1) would be compatible with our treatment of phonon wave vectors in units of cm-1. Depictions of a direct linear monatomic lattice along with its reciprocal lattice are shown in Figure 3. Each of the dots in the linear crystal lattice represents an atom and the distance between the atoms is given by the letter a. A reciprocal lattice can be constructed from the real lattice wherein the basis vector A of the reciprocal lattice is equal to 2π/a. Our reason for choosing basis vector increments of 2π/a rather than 1/a will soon become clear as we analyze a vibrational wave propagating through our one-dimensional lattice.

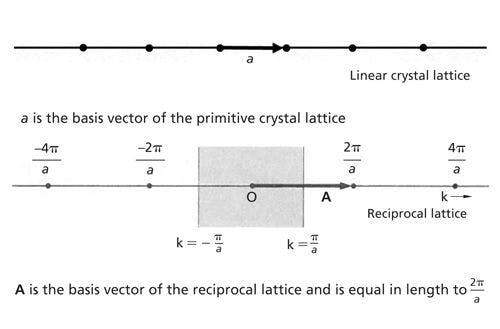
Figure 3: Real and reciprocal lattices of a linear monatomic crystal.
Let’s consider a phonon propagating through our hypothetical linear monatomic lattice. Without providing the derivation, we simply state that there is one solution for a wave traveling either to the right or left in a linear monatomic lattice. The angular frequency (ω) of that traveling wave or phonon is given by


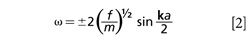
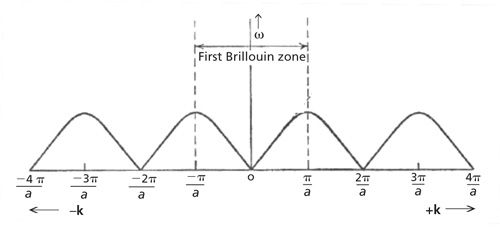
where f is the vibrational force constant, m is the atomic mass, k is the phonon wave vector, and a is the distance between the atoms. A plot of ω as a function of wave vector k is known as the phonon dispersion curve and is shown in Figure 4. The dispersion curve is repeating and reaches a maximum value of ω when k is equal to ±π/a because of the sine function in equation 2. Furthermore, the dispersion curve for a linear monatomic lattice is symmetric about the center value of 0 and is repeating beyond ±π/a. Therefore, we call the region between -π/a and +π/a in a linear monatomic lattice the first Brillouin zone and a k value of 0 is the Brillouin zone center. An important concept to grasp here is that because k is inversely related to λ, the longer the phonon wavelength is the closer it will be to the Brillouin zone center in the phonon dispersion curve.

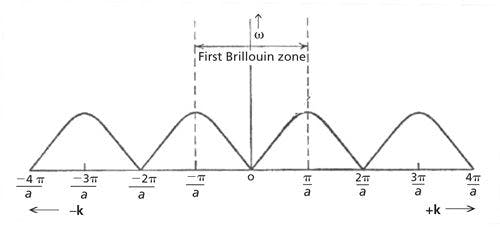
Figure 4: Phonon dispersion curve for a linear monatomic lattice.
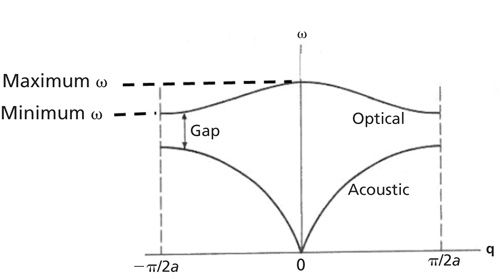
Progressing in our understanding of phonon propagation and dispersion curves, we now consider vibrational waves in a linear diatomic lattice. Again without providing the derivation or the mathematical expressions, we state that there are two solutions for waves traveling either to the right or left in the linear diatomic lattice. (Recall that there was only one solution for a traveling wave in a linear monatomic lattice. The derivations and analytical expressions for vibrational waves in linear monatomic and diatomic lattices can be found in all text books on solid-state physics.) A phonon dispersion curve for the two solutions of the wave equations of a linear diatomic lattice is shown in Figure 5. Note that for the acoustic branch solution to the linear diatomic lattice a maximum value of ω is reached when k is equal to ± π/2a as opposed to ±π/a for the linear monatomic lattice. The lower curve is called the acoustic branch and is similar to the phonon dispersion curve for the linear monatomic lattice. The upper optical branch is so named because these lattice vibrational waves can be excited with light of infrared wavelengths, energies much higher than those of the acoustic branch, especially at the Brillouin zone center. The optical branch phonons are the origin of the bands in the Raman spectrum of a solid. Of course, the number of Raman bands is dictated by the symmetry of the crystal and their energies by the masses of the atoms and force constants of the chemical bonds. It is especially important to note in Figure 5 that there is a range of frequencies for a given optical phonon with the maximum and minimum ω values at the Brillouin zone center and edge, respectively. The Raman bands would be very broad if all of those phonons from center to edge were sampled, and that is indeed the case for amorphous solids. The Raman intensity as a function of frequency for a given Raman band is related to populations of the phonon state as a function of wave vector from the Brillouin zone center to the edge, referred to as the phonon density of states. In contrast with amorphous solids, crystals restrict phonon sampling to the Brillouin zone center and therefore have narrow Raman bands as we explain in the following section.


Figure 5: Phonon dispersion curve for a linear diatomic lattice.
The Brillouin Zone and Conservation of Wave Vector
Of course, the real world of crystals is not one-dimensional but is three-dimensional. A detailed description of the construction of the Brillouin zone for a three-dimensional crystal lattice is beyond the scope of this article. That would involve a mathematical description of the construction of the reciprocal lattice from the real lattice (also called a direct lattice) and the subsequent construction of the Wigner-Seitz lattice from the reciprocal lattice. A helpful description of the construction of three-dimensional reciprocal lattices, Wigner-Seitz lattices and Brillouin zones is given in the excellent book by Richard Tilley (4). Nevertheless, we can describe one example to give you a sense of how the construction of a Brillouin zone is accomplished. Consider a face-centered cubic Bravais F crystal lattice in real space. The first step is to construct the reciprocal lattice of the face-centered cubic F crystal. Following the mathematical procedure for doing so produces a body-centered cubic I lattice. The next step is to construct a Wigner-Seitz cell from the body-centered I reciprocal lattice, thereby generating a truncated octahedron. The Wigner-Seitz truncated octahedron is the shape of the first Brillouin zone of the real face-centered cubic F lattice. Depictions of the face-centered cubic F unit cell and its corresponding first Brillouin zone are shown at the bottom of Figure 6. The first Brillouin zones of a simple cubic lattice and a body centered cubic I lattice are also shown in Figure 6. The significance of depicting the three-dimensional Brillouin zone is that we have just made the leap from one-dimensional to three-dimensional reciprocal space, which prepares us for the typical phonon dispersion curves found in the literature. Phonon dispersion curves generally plot the frequency of the phonon from the Brillouin zone center to the various crystal faces and points within the first Brillouin zone. You can find examples of the phonon dispersion curves and corresponding phonon density of states plots of various solids in the companion video lecture to this installment on YouTube (2).

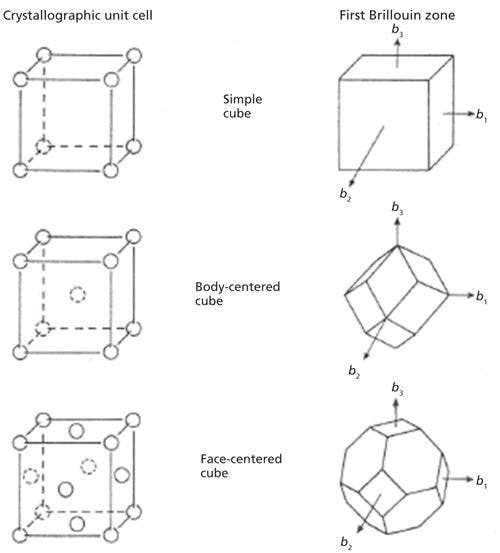
Figure 6: Real lattices of cubic crystals and their corresponding first Brillouin zones.

Having developed our understanding of the Brillouin zone and its basis in reciprocal space, we relate it to the wave vector in Raman scattering from a crystalline solid. Energy, wave vector, and momentum are conserved in the Raman scattering process involving real crystals, which are anharmonic. Therefore, the incident radiation transmits momentum to the crystal through the creation of a lattice vibrational wave or phonon. The momentum of the incident photon is equal to ħki and that of the newly created phonon is equal to ħq, where ħ is Planck’s constant divided by 2π and ki and q are the wave vectors of the incident photon and phonon, respectively. A wave vector diagram of Raman scattering in a crystal is shown in Figure 7. The conservation of the wave vector is implicit in the diagram, which shows the dependence of the direction at which the Raman scattered light is collected on the direction of phonon propagation. Of course, Raman scattering occurs in all directions. However, the angle with respect to the incident light at which one collects the Raman signal determines the propagation direction of the phonon that is being sampled. The angle of phonon propagation is one-half that of the angle at which Raman scattering is collected. This relationship is important because in some uniaxial and biaxial crystals the energies of certain phonons can vary depending upon the direction of phonon propagation in the crystal lattice. Practically, that means that the Raman band position can vary depending upon the orientation of a single crystal with respect to the direction and polarization of the incident light and the angle at which the Raman scattered light is collected. This phenomenon is known as phonon directional dispersion, and the variation of Raman band position is quite significant in some ferroelectric metal oxides.


Figure 7: Raman scattering and conservation of wave vector in a crystal. The wave vector of the phonon is given by q and those of the incident and Raman scattered photons are given by ki and ks, respectively.
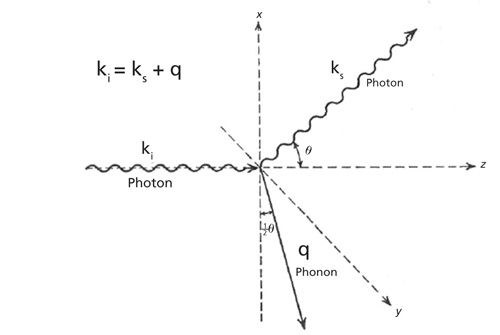
Creating a vector diagram for the wave vector equation shown in Figure 7 and solving for q gives us the expression


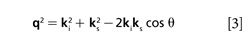
where ki and ks are the wave vectors of the incident photon and the Raman scattered photon, respectively. Raman scattering is generally performed with visible laser light. Assuming incident blue-green laser light of approximately 20,000 cm-1, a phonon of several hundred wavenumbers, and a Raman scattered photon also in the visible region, we make the approximation that ki ≈ ks. Consequently, equation 3 yields q ≈ 2ki for the 180° backscattering configuration. Substituting 2π/λ for ki given by equation 1 yields

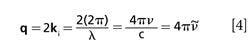

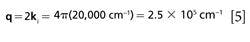
Where c is the speed of light and λ, ν, and are the wavelength, frequency and wavenumber of the incident laser light, respectively. Applying the laser light wavenumber of approximately 20,000 cm-1 in equation 4, we obtain a value for the phonon wave vector of


Now here is where we make the connection between the wave vector of the phonon to the Brillouin zone of the crystal through which it is propagating. We calculate the k value at the Brillouin zone edge (BZE), which is π/a (see Figure 3), where a is equal to the real lattice spacing. Let us assume a lattice spacing of 3 Å = 3 × 10⁻⁸ cm so that

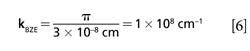
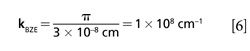
That is a difference of three orders of magnitude between the k value of the Brillouin zone edge and the wave vector of the phonon that we generate because of the wavelength of the laser light in our measurement. Therefore, only the Raman scattering from phonons of a very long wavelength, equal to several thousand atomic spacings, and small k value near the Brillouin zone center out to 2.5 × 105 cm-1 will be probed because of the requirement that wave vector and momentum be conserved. Furthermore, the slope of the phonon dispersion curve at the Brillouin zone center is close to 0 and the frequency ω of the phonon does not vary much in that region. It is this restriction of sampling only those phonons near the Brillouin zone center that results in the Raman bands from crystalline solids being so narrow.
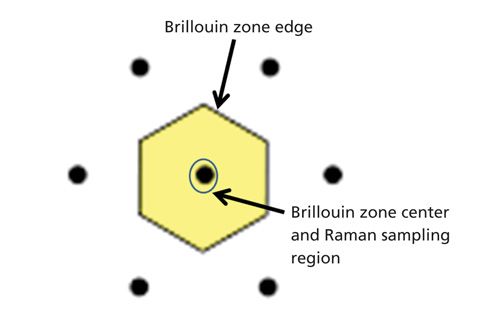
The diagram of the two dimensional reciprocal lattice in Figure 8 should help you get a sense of the restricted Raman sampling region near the Brillouin zone center. The region from the circle around the Brillouin zone center to the edge will have a distribution of phonon energy states as indicated in the phonon dispersion curve for any given solid. However, those phonons will be inaccessible in Raman measurements of crystals when using visible excitation because of the requirement to conserve wave vector and momentum. Remember that k = 2π/λ so that k increases with decreasing λ. We would need much shorter excitation wavelengths than those in the visible region of the spectrum to probe phonons beyond the Brillouin zone center out to the Brillouin zone edge at 108 cm-1. The instructive publication by Kettle and Norrby titled The Brillouin Zone - An Interface between Spectroscopy and Crystallography should be consulted for further information on this topic (5).


Figure 8: The Brillouin zone of a two-dimensional reciprocal lattice. Raman scattering excited with visible laser light will be generated only from the region very near the Brillouin zone center.
Loss of Translational Symmetry
Our discussion of reciprocal space and the Brillouin zone led to our treatment of the conservation of wave vector and momentum in conjunction with the Raman scattering of crystals. The existence of long-range translational symmetry in the medium through which the phonons propagate was essential to our treatment. However, what if there is no crystal lattice and the solid is amorphous or a glass? In an amorphous solid the observed Raman bands are no longer associated with traveling waves or wave vectors and are technically therefore no longer phonons. “In an amorphous solid, the vibrational modes are no longer plane waves (and k has no meaning), but we will continue to use ‘phonons’ as a convenient abbreviation for the vibrational elementary excitations of the solid” (6). All of the things discussed with regard to reciprocal lattice, Brillouin zone, and conservation of wave vector in a lattice no longer apply. There is neither a real nor reciprocal lattice in an amorphous solid. One detects scattering from local vibrational modes. The term “phonons,” as defined as lattice vibrational waves, is still used for convenience in describing the vibrational modes of amorphous solids or glasses because the Raman spectrum so closely resembles the phonon density of states. One might say that in an amorphous solid the entire Brillouin zone is now sampled. “In an amorphous solid, contributions from the entire phonon density of states appear in the first-order infrared and Raman spectra” (6). The short-range order and distribution of chemical bond interactions are apparent in vibrational spectra. All of the variations in bond angles and lengths in the formula units of the solid manifest themselves in the Raman spectrum such that the bands then appear very broad from the contributions of all of these modes.
The Raman spectrum of an amorphous solid resembles the phonon density of states for the crystalline form of the material. It is for that reason that it is stated that the entire Brillouin zone and not just the center is being sampled in the Raman spectrum of an amorphous or glassy solid. The 1971 publication by Smith and coworkers (7) demonstrates the good agreement between the Raman spectrum of amorphous Si and the calculated phonon density of states of crystalline Si. Very broad bands appear in the first order Raman spectra of amorphous solids because of the absence of long-range translational symmetry and a corresponding reciprocal lattice.
Conclusion
Energy and momentum are conserved in the Raman scattering process involving real crystals, which are anharmonic. Therefore, the incident radiation transmits momentum to the crystal through the creation of a lattice vibrational wave or phonon. Only phonons of a very long wavelength, equal to several thousand atomic spacings, and small k value near the Brillouin zone center are probed. The slope of the phonon dispersion curve at the Brillouin zone center is close to 0 and the frequency ω of the phonon does not vary much in that region. It is this restriction of sampling only those phonons near the Brillouin zone center that results in the Raman bands from crystalline solids being so narrow. The term “phonons,” as defined as lattice vibrational waves, is still used for convenience in describing the vibrational modes of an amorphous solid because the Raman spectrum so closely resembles the phonon density of states. One might say that the entire Brillouin zone is now sampled in an amorphous solid.
References
- D. Tuschel, Spectroscopy29(9), 14–21 (2014).
- P.M.A. Sherwood, Vibrational Spectroscopy of Solids (Cambridge University Press, London, 1972), p. 4.
- R. Tilley, Crystals and Crystal Structures (Wiley, Chichester, 2007), pp. 25–28.
- S.F.A. Kettle and L.J. Norrby, J. Chem. Educ.67, 1022–1028 (1990).
- R. Zallen, The Physics of Amorphous Solids (Wiley, New York, 1983), p. 270.
- J.E. Smith, Jr., M.H. Brodsky, B.L. Crowder, M.I. Nathan and A. Pinczuk, Phys. Rev. Lett. 26, 642–646 (1971).


David Tuschel is a Raman applications manager at Horiba Scientific, in Edison, New Jersey, where he works with Fran Adar. David is sharing authorship of this column with Fran. He can be reached at: SpectroscopyEdit@UBM.com


Newsletter
Get essential updates on the latest spectroscopy technologies, regulatory standards, and best practices—subscribe today to Spectroscopy.