All PublicationsSpectroscopySpectroscopy SupplementsApplication NotebookE-Books
All ColumnsAtomic PerspectivesChemometrics in SpectroscopyFocus on QualityIR Spectral Interpretation WorkshopIcons of SpectroscopyLasers and Optics InterfaceMolecular Spectroscopy Workbench
All NewsInterviewsSpectroscopy Sponsored News
All Application NotesAtomic SpectroscopyGeneralMass SpectrometryMolecular Spectroscopy
Conference CoverageConference Listing
Webcasts
ProductsE-BooksEventsPeer ExchangeAnalytically Speaking PodcastSponsored PodcastsSpecTubeSponsored ContentSponsored VideosAsk the ExpertsContent Engagement HubsInteractive Tools
SubscribeDirectory
Analytical Instrumentation
Analytical Method Validation
Analytical Theory
Annual Salary Survey
Atomic Absorption
Atomic Spectroscopy
Biological, Medical, and Clinical Analysis
Biopharmaceuticals Biotechnology and Protein Analysis
Cannabis Analysis
Corporate Profiles
Data Analytics, Statistics, Chemometrics, and Artificial Intelligence
Dietary Supplements Analysis
Energy, Petroleum, and Bio Energy
Environmental Analysis
Far-IR/Terahertz Spectroscopy
Fluorescence
Food and Beverage Analysis
Forensics, Narcotics
GC-MS
Homeland Security
ICP-MS
ICP-OES
Imaging
Infrared (IR) Spectroscopy
LC-MS
LIBS
Lasers and Laser-Source Technologies
Market Profiles
Mass Spectrometry
Molecular Spectroscopy
NMR
Near Infrared (NIR) Spectroscopy
Optics
Peer-reviewed Articles
Pharmaceutical Analysis
Plastics Polymers and Rubber
Portable and Handheld Spectroscopy
Process Control and Analysis
Quality Control/Quality Assurance (QA/QC)
Quality by Design (QbD)
Raman Spectroscopy
Regulatory Standards/GLP/GMP Compliance
Sample Preparation
Spectroscopy Interviews
Surface-enhanced Raman spectroscopy (SERS)
Technology Forum
Trends
Tutorials
UV-vis Spectroscopy
Vendor Tips & Tricks
Web of Science
X-ray Analysis
Spotlight -
  • Molecular Spectroscopy In and Out of the Lab
  • Sample Preparation for ICP Analysis
IS1
  • Applied Clinical Trials

  • BioPharm International

  • Cannabis Science and Technology

  • Chromatography Online

  • Nutritional Outlook

  • Pharmaceutical Commerce

  • Pharmaceutical Executive

  • Pharm Tech

  • Spectroscopy Online

  • Turbo Machinery Magazine

Analytical Instrumentation
Analytical Method Validation
Analytical Theory
Annual Salary Survey
Atomic Absorption
Atomic Spectroscopy
Biological, Medical, and Clinical Analysis
Biopharmaceuticals Biotechnology and Protein Analysis
Cannabis Analysis
Corporate Profiles
Data Analytics, Statistics, Chemometrics, and Artificial Intelligence
Dietary Supplements Analysis
Energy, Petroleum, and Bio Energy
Environmental Analysis
Far-IR/Terahertz Spectroscopy
Fluorescence
Food and Beverage Analysis
Forensics, Narcotics
GC-MS
Homeland Security
ICP-MS
ICP-OES
Imaging
Infrared (IR) Spectroscopy
LC-MS
LIBS
Lasers and Laser-Source Technologies
Market Profiles
Mass Spectrometry
Molecular Spectroscopy
NMR
Near Infrared (NIR) Spectroscopy
Optics
Peer-reviewed Articles
Pharmaceutical Analysis
Plastics Polymers and Rubber
Portable and Handheld Spectroscopy
Process Control and Analysis
Quality Control/Quality Assurance (QA/QC)
Quality by Design (QbD)
Raman Spectroscopy
Regulatory Standards/GLP/GMP Compliance
Sample Preparation
Spectroscopy Interviews
Surface-enhanced Raman spectroscopy (SERS)
Technology Forum
Trends
Tutorials
UV-vis Spectroscopy
Vendor Tips & Tricks
Web of Science
X-ray Analysis
IS1
  • Applied Clinical Trials

  • BioPharm International

  • Cannabis Science and Technology

  • Chromatography Online

  • Nutritional Outlook

  • Pharmaceutical Commerce

  • Pharmaceutical Executive

  • Pharm Tech

  • Spectroscopy Online

  • Turbo Machinery Magazine

    • Webcasts
    • Subscribe
    • Directory

Article

Application Notebook

September 3, 2017

Application Notebook

Application Notebook-09-01-2017
Volume32
Issue 9

Blink and You Miss It—Catching Fleeting Catalytic Intermediates by High-Speed 785 nm NIR Raman Spectroscopy

Author(s):

Cobolt AB

It is only in the last two decades that Raman spectroscopy has begun to realize its potential as an almost universally applicable analytical technique from materials and life sciences applications to point of care analysis. This is primarily thanks to the availability of compact laser sources, high sensitivity cameras and high resolution compact spectrometers. In this application note the use of a stable high power NIR 785 nm laser is shown to be critical in achieving high time resolution and high signal to noise ratios while allowing for both fast and slow processes to be captured simultaneously.

Catching Transient Species

The weakness of detectors in the NIR region (800–1050 nm) with quantum efficiency dropping off over this range from ca. 40% to 0% is a key drawback of 785 nm Raman spectroscopy. Typically long exposure times and spectral averaging are required to achieve a good signal to noise level, however this approach seriously reduces the time resolution achieved (to minutes) and means that weak signals for compounds that are present for only a few 100s of milliseconds cannot be observed. Using more efficient NIR detectors (such as back thinned CCDs) does not usually solve this problem due to etaloning that can be difficult to suppress. This drawback can be circumvented by a combination of efficient collection optical arrangements and above all high laser light fluxes. With a stable high powered laser (500 mW at sample) and a large confocal volume for collection to limit sample damage, time resolutions as low as 100 ms per spectrum can easily be achieved.

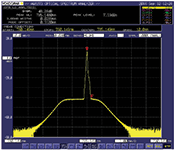
As an example, a oxidation reaction in which H2O2 is added to a solution containing a precatalyst is chosen. In this reaction only 0.25 mM precatalyst is present (far below that which can be detected by Raman spectroscopy but its absorption at 785 nm means that its spectrum is resonantly enhanced) and H2O2 is added to give a final concentration of 250 mM which decreases slowly over time. Within 1 s of addition of H2O2, however, the precatalyst becomes activated with an intermediate that is present only with a maximum concentration of 0.05 mM for 0.5 s and has an absorption band near 785 nm which results in enhancement of its Raman spectrum by ca. 10,000 times through resonance. However, it is observed only because high signal to noise spectra can be recorded at 200 ms intervals.
Lasers for Raman Spectroscopy

By far the most popular wavelength used for Raman spectroscopy is 785 nm, as it offers the best balance between avoiding fluorescence, absorption of the laser light (and Raman scattering) by the sample and therefore heating effects, and the limits to detector sensitivity. The lasers available at 785 nm are diode lasers, however, a narrow line width (<3 cm-1 for condensed phases such as solids and solutions and even narrower for gases) is essential for Raman spectroscopy in order to resolve individual Raman bands. The Cobolt 08-NLD 785 nm laser addresses all of the important performance features in a compact footprint and ensures reliability thanks to the proprietary manufacturing technique called HTCure™.

Cobolt AB
Vretenvägen 13, 17154 Solna, Sweden
tel. 46 8 545 912 30
Website: www.coboltlasers.com

Articles in this issue

Spectroscopy1_i1.jpg
Digestion of Difficult APIs in Accordance with USP
Spectroscopy1_i1.jpg
Digestion of Difficult APIs in Accordance with USP
Spectroscopy4_i1.gif
Blink and You Miss It—Catching Fleeting Catalytic Intermediates by High-Speed 785 nm NIR Raman Spectroscopy
Spectroscopy3_i1.jpg
Total Mercury in Coal Using Direct Mercury Analysis
Spectroscopy2_i1.gif
Considerations When Analyzing Real-World Samples by ICP Spectrometry
Spectroscopy5_i1.gif
SERS Methods Detect Trace Levels of Cocaine, Heroin, Methamphetamine, and THC

Newsletter

Get essential updates on the latest spectroscopy technologies, regulatory standards, and best practices—subscribe today to Spectroscopy.

Subscribe Now!
Related Content
Advertisement
Site Logo
August 21st 2025

Raman Microscopy Applied to Polymer Characterization

HORIBA
Site Logo
August 21st 2025

GoldenEye - The Ultimate Snapshot Imager (July 2024)

BaySpec, Inc.
Site Logo
August 21st 2025

Raman and PSI Study of Graphene

Nanobase, Inc.
Site Logo
August 21st 2025

Fluorescence lifetime imaging microscopy (FLIM) (Oct 2023)

Reinishaw
Site Logo
August 21st 2025

Tandem Raman and IR spectroscopies for monitoring of soil gases in CO2 sequestration

Endress+Hauser
Site Logo
August 21st 2025

Shining Light on Graphite Purity

Ocean Insights
About
Advertise
Author Guidelines
Contact Us
Editorial Advisory Board
Ethics Statement
Do Not Sell My Personal Info
Permissions
Privacy Policy
Subscriptions
Terms and Conditions
Contact Info

2 Commerce Drive
Cranbury, NJ 08512

609-716-7777

© 2025 MJH Life Sciences

All rights reserved.