SPEC PerkinElmer 11.10
|Webcasts|September 15, 2021

Interferences Explained, ICP-OES Part 1

Wednesday, September 15, 2021 at 11am EDT| 8am PDT| 4pm BST| 5pm CEST Do you have problems with false positive or negative results with your ICP-OES or ICP-MS analyses? Are you wondering where the interferences causing these errors are coming from? If so, join this webinar to learn how to identify interferences, develop strategies to manage them and discover new hardware solutions that enable unprecedented levels of accuracy for your elemental analysis.

Register Here: http://www.spectroscopyonline.com/spec_w/ICPOES

Event Overview:

Interferences are a well-known problem in both inductively coupled plasma–optical emission spectroscopy (ICP-OES) and ICP–mass spectrometry (ICP-MS). They can be subdivided into three main types: chemical, physical, and spectral.

  • Chemical interferences are caused by differences in the way sample and calibration solution matrices behave in the plasma, resulting in changes in atomization and ionization that are dependent on the matrix composition of the sample. An example of this type of interference is the enhancement effect (which causes falsely high results) observed on both atom and ion signals for elements such as arsenic and selenium, when carbon is present in the samples but not the calibration solutions.
  • Physical interferences are also caused by matrix differences between samples and calibration solutions. Examples of this type of interference include signal suppression (due to high amounts of easily ionized elements, such as sodium, in the samples), drift and signal variability from sample to sample caused by, for example, changes in nebulization efficiency as a result of viscosity differences between samples. These interferences can cause reported results to be either too high or too low if they are not properly corrected for.
  • The last, and most challenging, type of interference is spectral interference. For ICP-OES, these are observed as either direct or partial emission wavelength overlaps on the signals of target analytes from other elements or molecular species in the sample. For ICP-MS, spectral interferences from other elements in the sample appear as either direct (from singly charged ions) or half-mass (from doubly charged ions) overlaps on the target ion isotope signals. With ICP-OES, spectral interferences, like physical interferences, can cause falsely high or falsely low results. With ICP-MS, the overlaps caused by interfering signals generate false positive signals, but if incorrect mathematical corrections are applied to the data, falsely low results can also be reported.

In this two-part webinar series, the sources of interferences in ICP-OES and ICP-MS and how to identify them will be described. Software approaches for correcting interfered results which each technique will be presented and the latest instrumental developments for minimizing interference problems will also be discussed.

Key Learning Objectives:

  • Understand what types of interferences exist in ICP-OES and ICP-MS and how they affect your results.
  • Learn strategies for identifying and managing these interferences.
  • Find out how innovations in hardware help reduce interferences, improve accuracy, and remove the need to re-run samples.
  • Discover how intelligent software tools enable easier, interference-free method development.

Who Should Attend:

  • Analysts wishing to enhance their elemental analysis knowledge
  • Instrument operators who encounter problems with inaccurate data and want to know how improve their results.
  • Laboratory managers who need to lower detection limits, reduce sample re-runs, and accelerate sample turnaround times


Register Here: http://www.spectroscopyonline.com/spec_w/ICPOES

Related to this article

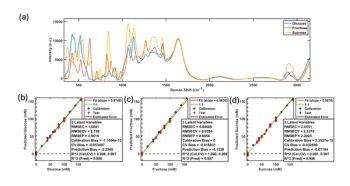
Monitoring Sugar Consumption and Ethanol Production During Yeast Fermentation Using a Raman Plate Reader and Multivariate Analysis
This column shows that a Raman plate reader paired with partial least squares regression can simultaneously quantify glucose, fructose, sucrose, and ethanol in yeast fermentation samples, using turbidity-matched calibration standards to correct for yeast-induced turbidity, and offers a rapid, label-free, high-throughput method for tracking sugar consumption and ethanol production in strain screening, media optimization, and process development.
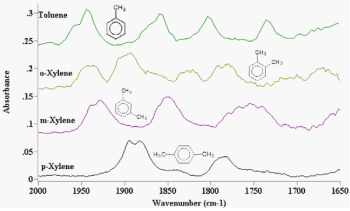
Highly Substituted Benzene Rings—The Rest of the Story II: Spectra
This column, the second installment on highly substituted benzene rings, shows that tri- and tetra-substituted substitution patterns can be distinguished by whether the ring bending peak is present and by the position of the in-phase aryl C-H wagging peak, which shifts according to how many adjacent hydrogens the ring carries.
Healthcare administrator reviewing an insurance policy schedule with a stethoscope on a clipboard, health insurance coverage, medical underwriting, prior authorization, and patient claims processing. | Image Credit: Joi_studio - stock.adobe.com
In a SciX interview, Marc Porter covered a lot of ground, from a student-driven pivot into immunoassays to a baseball analogy for Stokes and anti-Stokes scattering, and shares the open questions he is still chasing.
Ingots of pure copper or pink gold on a black background. | Image Credit: Phawat - stock.adobe.com
At SciX, Kevin Wilkinson of the Universite de Montreal explains how faster data acquisition and new software have cut analysis time and how a particle’s chemical composition can link arsenic-bearing emissions back to a copper refinery’s processes.
Spectral Frontiers: Seeing the Unseeable Microspectroscopy
Microspectroscopy, the marriage of spectroscopic chemical identification with microscopic spatial resolution, has advanced from Perkin-Elmer's first commercial infrared microspectrometer in 1953 to today's nanoscale AFM-IR probes, synchrotron-brightness infrared beamlines, and compact hyperspectral tissue imaging devices being developed for AI-assisted cancer detection.