How has Raman spectroscopy been applied to the development of materials that are important in technology?

Fran Adar is the Principal Raman Applications Scientist for Horiba Scientific in Edison, New Jersey.
How has Raman spectroscopy been applied to the development of materials that are important in technology?
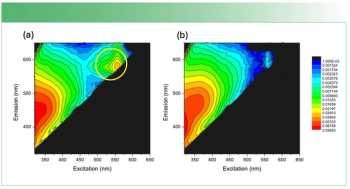
This column will show Raman results and ATEEM fluorescence whose correlations indicate that important information is available non-destructively.
In this "Molecular Spectroscopy Workbench" column, a new spectroscopy, called A-TEEM, is explored.

In this column, we will describe what is known about the structures of these materials and how Raman spectroscopy can characterize them.

In this column, I describe what I believe may be the origin of this fluorescence emission and support my conjecture with some measurements of polycyclic aromatic hydrocarbons (PAHs). Understanding the origin of these interfering backgrounds may enable you to design experiments with less interference, avoid the laser illuminations that make things worse, or both.

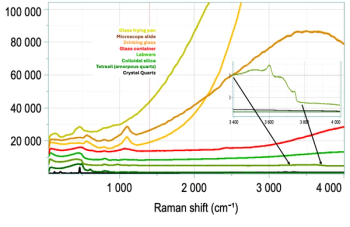
Because there is a different Raman signature for each of the polymorphs as well as the contaminants, Raman microscopy is an ideal tool for analyzing the structure of these materials as well as identifying possible contaminants that would also interfere with performance.

In this article, we show a cross-sectional map of a film compared to a depth profile to evaluate the quality of depth profile measurements.

Here, we will show the chemical and spectral changes that occur during the cure of a commercial epoxy.

The use of polarized Raman microscopy to complement the polarized light micrographs of spherulites in polymers reveals much about the orientation behavior of the lamellae in spherulites.
Raman spectroscopy has the capability of accurately determining the physical and chemical properties of bioplastics (polyhydroxybutyrate hexanoate [PHBHx]), which helps determine the maximum crystallinity a polymer can experience.

Studying the crystallinity of biodegradable polymers can be done without the complexity of larger instruments. Here’s how.

Extractables and leachable are typically studied using chromatographic techniques. This study explores what we can learn by using from using Raman microscopy for such studies.

Here, we explain how Raman spectroscopy is valuable for characterizing industrially important carbon materials.

Raman spectra can help determine protein structure. Here’s how.

Innovative database search technology can help Raman spectroscopists identify molecular vibrations; here, we show how to use these tools more effectively.
We illustrate how matching the optical properties of the microscope objective with the sample properties improves the spatial resolution and chemical speciation in depth profile measurements using confocal Raman microscopy.
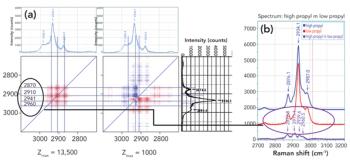
Raman spectra were measured in combination with 2D-COS analysis to understand how the addition of propyl side groups to a biopolymer backbone influences the structure of the polymer at the atomic level.

Low frequency Raman scattering measurements can be used to predict physical properties of polymers and the crystalline polymorphic form of active pharmaceutical ingredients (APIs). These measurements are made by recording the Stokes and anti-Stokes side of the laser line with the laser centered on the detector. Spectra of polyethylene and linear alkanes were recorded down to 4 cm-1.

Spectroscopy
Raman microscopy, combined with X-ray fluorescence, can provide detailed information about extractables and leachables from medically implantable devices.
Spectroscopy
Raman 2D-COS spectral data provide information on conformational changes of polymers. Here, Raman spectra of ethylene vinyl acetate and vinyl acetate copolymer are measured and interpreted, enabling a description of morphological changes related to the vinyl acetate group.
Spectroscopy
The spectral behavior of water is studied using Raman with an NIR spectrograph and dual wavelength lasers for measurements of both the fingerprint and the OH stretching regions. Raman spectra are recorded between 5 ⁰C and 80 ⁰C, and treated with both band-fitting and the 2D-COS algorithm revealing improved insights into the spectral behavior of water.
Spectroscopy
Two-dimensional correlation spectroscopy (2D-COS) can reveal subtle chemical interactions that are difficult to discern when analyzing individual spectra. A demonstration of the subtleties of this technique can be seen in the analysis of ethanol–water and ethanol–methanol mixtures.
Spectroscopy
Spectral changes revealed by two-dimensional correlation spectroscopy can be used to interpret structural changes in polymers determined by processing conditions, so that materials can be rationally engineered for particular applications with known mechanical requirements.
Spectroscopy
The resonance Raman spectra of carotenoids vary with subtle changes on the functional side groups, making these spectra useful for identifying and characterizing carotenoids.
Spectroscopy
Controlling the orientation of the laser and Raman polarization relative to the sample orientation can provide a wealth of information in the Raman spectrum that would be difficult to achieve by other methods. Presentation of the spectra makes these effects appear straightforward, but because of multiple instrumental factors, and experimental design, it is easy to produce erroneous results. This column is going to explain what instrumental components affect the polarization effects that are observed, and how the sample setup itself affects the Raman signal.

Spectroscopy E-Books

Spectroscopy E-Books
Spectroscopy
Raman spectra of celluloses modified for use in the pharmaceutical, food, and materials industries will be compared and analyzed, with the goal of determining spectroscopic features that can be of use in aiding in the determination of physical and chemical properties.
Spectroscopy
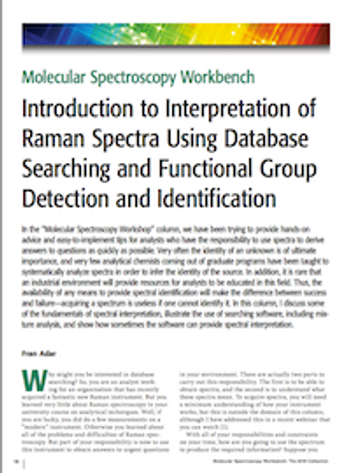
In the “Molecular Spectroscopy Workshop” column, we have been trying to provide hands-on advice and easy-to-implement tips to start using spectroscopic tools for the analyst who has the responsibility to derive answers to questions as quickly as possible. Very often the identity of an unknown is of ultimate importance, and very few analytical chemists coming out of graduate programs have been taught to systematically analyze spectra to infer identity of the source. In addition, it is rare that an industrial environment will provide resources for the analyst to be educated in this field. Thus, the availability of any means to provide spectral identification will make the difference between success and failure; that is, acquiring a spectrum is useless if one cannot identify it. In this column, I discuss some of the fundamentals of spectral interpretation, illustrate the use of searching software, including mixture analysis, and show how sometimes the software can provide spectral interpretation.

February 1st 2022

January 2nd 2025

February 1st 2024
December 16th 2025