The Infrared Spectra of Polymers III: Hydrocarbon Polymers
We continue to examine the spectra of polymers because they are important materials, and this exercise makes for an excellent infrared (IR) spectral interpretation review. In this installment, we look at the spectra of more hydrocarbon polymers, including polypropylene and polystyrene. We look at the IR spectra of these materials in detail, and see how IR spectroscopy can be used to distinguish them from each other.
In the first two installments (1,2) in our examination of polymer infrared (IR) spectra, the only material whose spectrum we have studied so far is polyethylene (PE). In this column, we move on to examine the spectra of some related materials: hydrocarbon polymers.
I define hydrocarbon polymers as polymers that are composed only of hydrogen and carbon. This restriction to only two chemical elements may seem to limit the substances we can study, but the beauty of carbon is that it exhibits such a rich and varied chemistry that, even with just C and H as building blocks, an amazing variety of polymeric materials can be synthesized. By the way, I realize PE is a hydrocarbon polymer, but I chose to not discuss this term until now.
Polypropylene
Most of the us know polymers by another name—plastics. And although I am not sure that they are the future as a young Benjamin Braddock was advised in the movie “The Graduate” (3), plastics certainly abound, which is why they need to be recycled. In the recycling business, it is best to sort plastics by their chemical composition to obtain purer material that is more valuable and easier to process into new things. As you may know, if you have ever looked closely at an article made of plastic, they are often stamped with a number from 1 to 7 to denote their composition. In this scheme, high density polyethylene is identified by a 2, low density polyethylene a 4, and polypropylene a 5. However, not all plastic articles have these identifying numbers, and manual sorting by reading the numbers and tossing into bins is too slow for the vast amount of plastics being recycled these days. That is why automatic sorters have been invented that use IR spectroscopy to identify objects as they go by on a conveyor belt, and then a puff of air blows the object into the appropriate bin when it leaves the belt (4). The infrared spectrum of polypropylene (PP) is sufficiently different from that of the polyethylenes to make sorting them easy. The chemical structure, infrared spectrum, and peak assignments for polypropylene are seen in Figure 1.

 spectrum, and peak assignments for polypropylene.")
FIGURE 1: The chemical structure, infrared (IR) spectrum, and peak assignments for polypropylene.
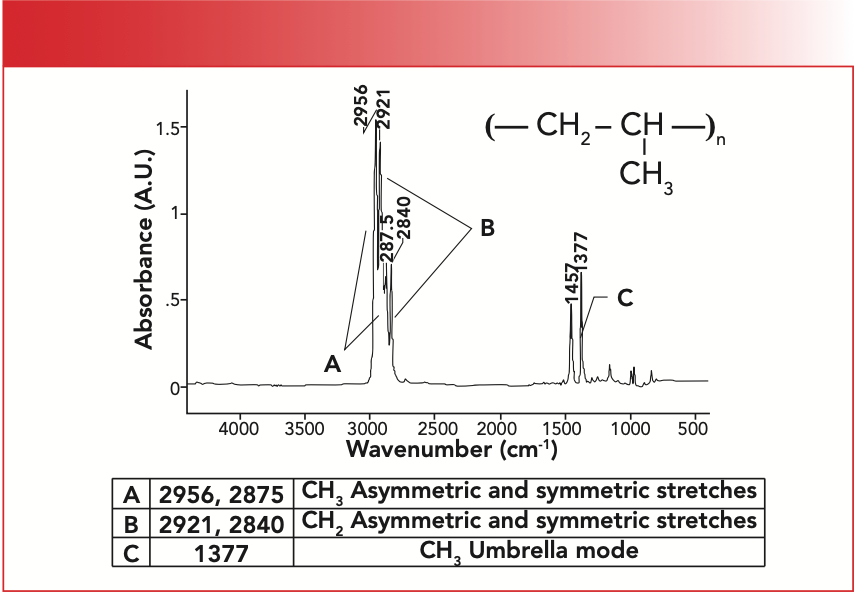
Like PE, which is made from the ethylene monomer and where the C=C bond splits open to form chains, PP is also made from a monomer where the C=C reacts to form chains. Note from Figure 1 that the PP repeating unit contains a CH2 and a CH3, and that the methyl group is not part of the polymer chain, but hangs down from it, which is why it is called a pendant group. The major structural difference, then, between polyethylene (PE) and polypropylene (PP) is that PE contains no methyl groups (the high density version at least) (1,2), whereas PP clearly contains them. Figure 1 shows that PP has CH3 stretching peaks at 2956 and 2875 (going forward all peak positions will be in wavenumber [cm-1] units even if not noted) labeled A, CH2 stretching peaks at 2921 and 2840 labeled B, and the methyl group umbrella mode at 1377 labeled C.
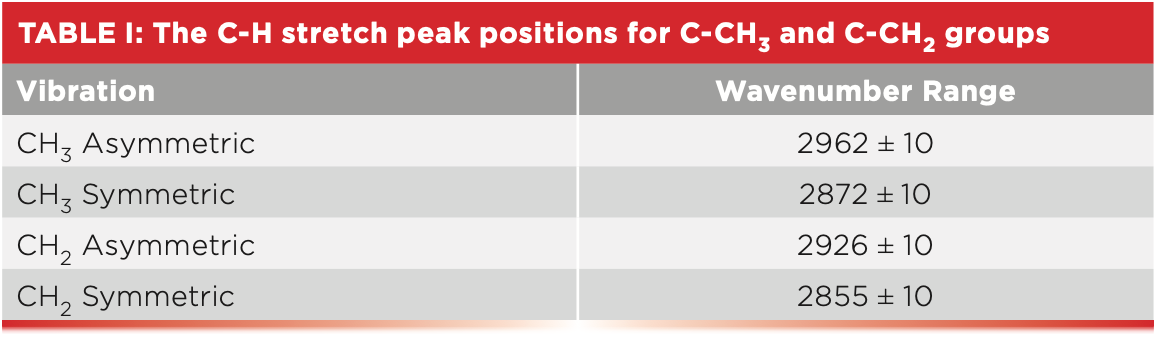
One of the beauties of our study of polymers is the opportunity to review some of what we have learned about IR spectral interpretation. Recall that methyl and methylene groups both have asymmetric and symmetric C-H stretching vibrations. Their peak positions are listed in Table I (5).


We have also learned that methyl and methylene groups have C-H stretching peaks (6), and, for CH3 groups, the umbrella bending mode typically falls at 1375±10. An examination of Figure 1 shows that PP follows these rules well.
Another thing we have learned is that knowing the number of C-H stretching peaks between 3000 and 2850 is useful (5). This is summarized in Table II.

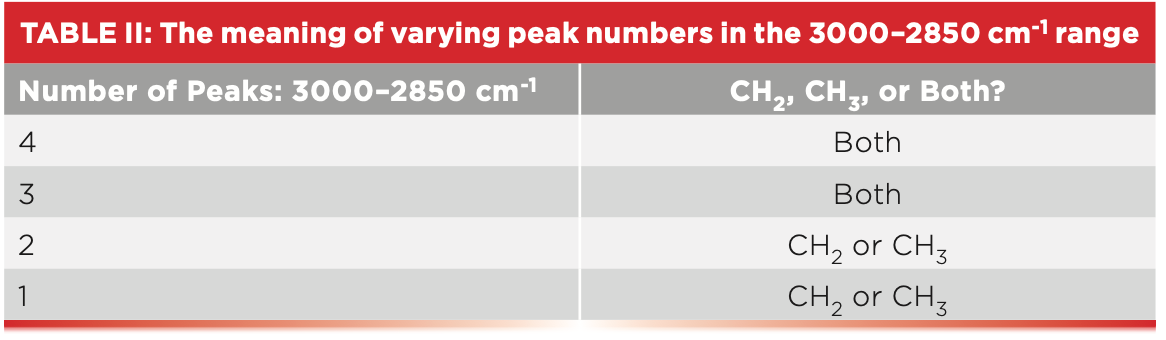

Because both methyl and methylene groups have two peaks in this range, the presence of four peaks means both are present. When long alkyl chains are present, the CH3 asymmetric stretching peak can be hidden by a much stronger CH2 asymmetric stretching peak (7), in which case three peaks will be present between 3000 and 2850. However, this still means both CH2 and CH3 are present, because each of these groups by themselves exhibits only two peaks in the region. However, if you only see two peaks between 3000 and 2850, it means either methyl or methylene are present, and you can use Table I to identify the functional group present. Because polypropylene contains both methyl and methylene groups, it has four peaks between 3000 and 2850, as seen in Figure 1, whereas, since polyethylene only contains CH2, it has two peaks in this region (1,2). So, a quick way to distinguish between these two polymers would be to simply count the number of peaks between 2850 and 3000.
Polystyrene
Another recyclable plastic that is all around us is polystyrene, denoted by a 6 on the plastics recycling chart. The structure, spectrum, and peak assignments for polystyrene are seen in Figure 2.

 spectrum, and peak assignments for polystyrene.")
FIGURE 2: The chemical structure, infrared (IR) spectrum, and peak assignments for polystyrene.
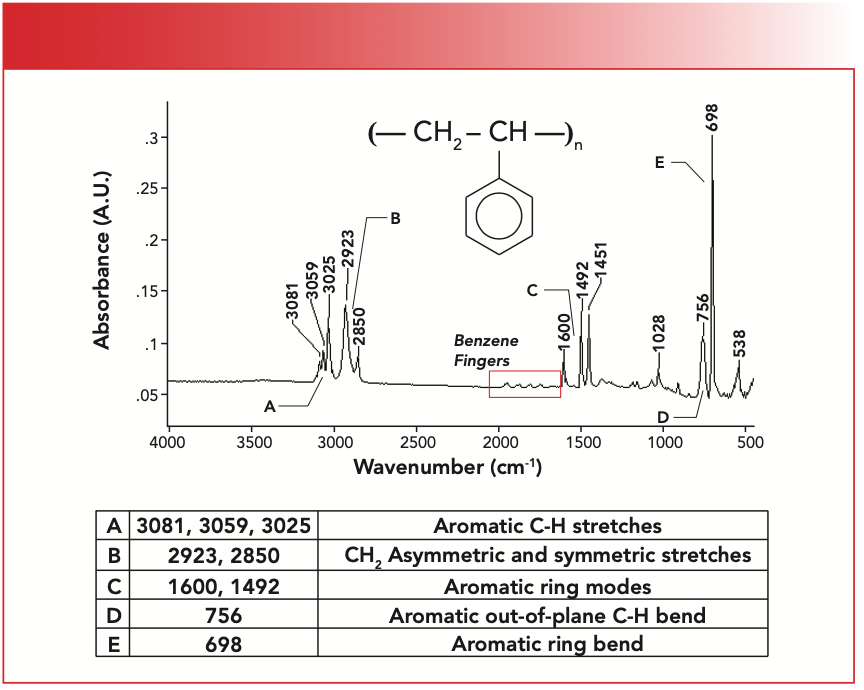
Note that the structure of polystyrene contains a CH2 and a mono-substituted benzene ring pendant group. Recall that saturated C-H stretches fall below 3000 as we have seen above, and that unsaturated C-H stretches fall above 3000 (8). The fact that polystyrene has C-H stretches above and below 3000 means it is a mixed molecule, that is it contains saturated and unsaturated carbons; in this case, the unsaturated carbons are from the benzene ring. The unsaturated C-H stretching peaks are at 3081, 3059, and 3025, and are labeled A in Figure 2. Polystyrene has only two saturated C-H stretching peaks between at 2923 and 2850, labeled B in Figure 2, because it contains methylene only, congruent with Table II.
Recall (8) that benzene rings have what are called “ring modes” from the stretching of the carbon-carbon bonds in the ring. These typically fall from 1620 to 1400 (8). In Figure 2, the peak at 1600 is a ring mode and is labeled C. This peak also has great importance outside the field of polymers. Most infrared spectrometers are sold with a polystyrene sample, and the position of this peak at 1600 has been used for decades as a wavenumber standard (9). Now you know that it is a benzene ring mode.
We have also studied how to distinguish between mono- and di-substituted benzene rings using the presence or absence of the ring bending band at 690±10 and the position of the C-H wagging vibration (10). This info is summarized in Table III.


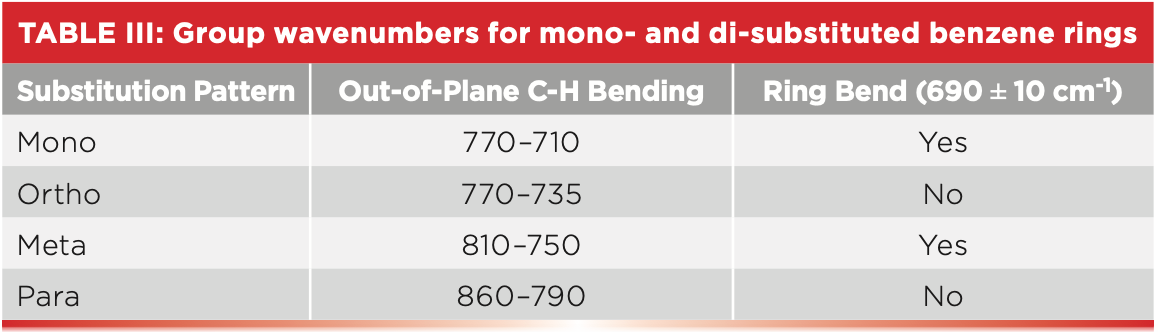
Polystyrene has a ring bending peak at 698, labeled E in Figure 2. Note that this is the biggest peak in the spectrum, and is hard to miss. The C-H wag is next at 756 and is labeled D. A close reading of Table III indicates we are in trouble here. Note that both mono- and meta- molecules have the 690 peak, and their C-H wagging ranges overlap from 770 to 750. This means if a spectrum has a ring bend peak and a C-H wag from 770 to 750, the molecule could be meta- or mono-. Given that polystyrene exhibits the ring bend peak at 698 and its C-H wag is at 756, we cannot tell whether it is mono- or meta-.
What are we to do? Recall (11) that we can use what are called the “benzene fingers” to solve this problem. The benzene fingers are a series of weak overtone and combination bands which fall from 1650 to 2000. The pattern of peaks they form can be used to distinguish mono-, ortho-, meta-, and para-substituted benzene rings. The patterns are seen in Figure 3.


FIGURE 3: The “benzene finger” peaks for mono-, ortho-, meta-, and para- substituted benzene rings.
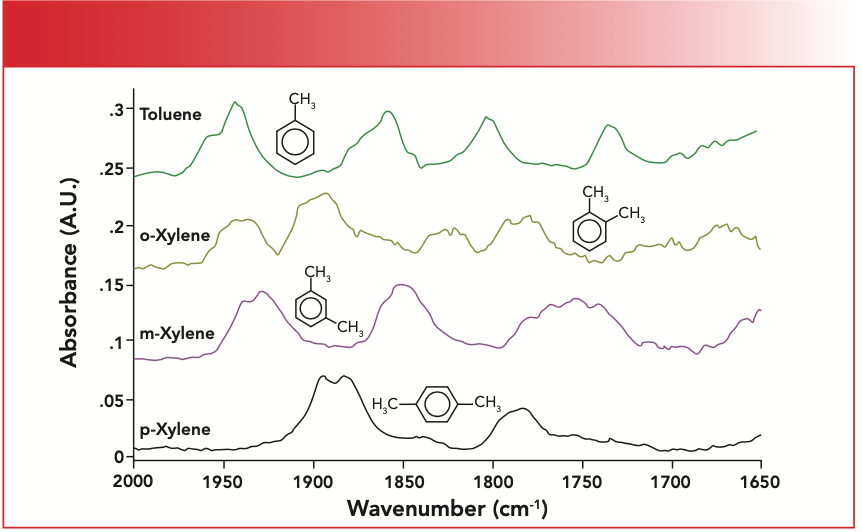
Recall that mono-rings have four evenly spaced benzene fingers, as illustrated by the spectrum of toluene seen in the top of Figure 3, and that meta-molecules have three benzene fingers, as seen in the spectrum of meta-xylene in the figure.
The benzene fingers of polystyrene are labeled in Figure 2. Note that there are four of them evenly spaced, which corresponds to the pattern seen for toluene in Figure 3, a mono-substituted benzene ring. Hence, we conclude that polystyrene contains a mono-substituted benzene ring. Note the low intensity of the benzene finger peaks in Figure 3, which means they may not always appear if there are stronger peaks in this wavenumber region, or if the molecule containing the benzene ring is present in low concentration. We learned here that the benzene fingers are useful—when we can see them.
Conclusions
Two hydrocarbon polymers that are commonly found and recycled are polypropylene (PP) and polystyrene. PP is the first example we have seen of a pendant group, where a functional group hangs off the chain. In the case of PP, it is a methyl group. We found that PP and polyethylene are easy to distinguish because the former contains CH2 groups only, and has just two C-H stretching peaks between 3000 and 2850, whereas PP has methyl and methylene groups so has four peaks in this range. PP also has a clear CH3 umbrella mode at 1377. We also studied the spectrum of polystyrene, and found that we had to use the benzene fingers to determine whether its pendant benzene ring is mono- or meta-substituted. In this case, it is mono-substituted.
References
(1) B.C. Smith, Spectroscopy 36(9), 24–29 (2021).
(2) B.C. Smith, Spectroscopy 36(7), 17–22 (2021).
(3) “The Graduate,” directed by M. Nichols, United Artists (1967).
(4) B. Sinram, I. Lavasseur, and N. Lortie, Canadian patent 2,642,690.
(5) B.C. Smith, Spectroscopy 30(4), 18–23 (2015).
(6) B.C. Smith, Spectroscopy 30(7), 26–31, 48 (2015).
(7) B.C. Smith, Spectroscopy 30(9), 40–46 (2015).
(8) B.C. Smith, Spectroscopy 31(3), 34–37 (2016).
(9) B.C. Smith, Fundamentals of Fourier Transform Infrared Spectroscopy (CRC Press, Boca Raton, Florida, 2nd Ed., 2011).
(10) B.C. Smith, Spectroscopy 31(5), 36–39 (2016).
(11) B.C. Smith, Spectroscopy 31(9), 30–33 (2016).


Brian C. Smith, PhD, is the founder and CEO of Big Sur Scientific, a maker of portable mid-infrared cannabis analyzers. He has over 30 years experience as an industrial infrared spectroscopist, has published numerous peer-reviewed papers, and has written three books on spectroscopy. As a trainer, he has helped thousands of people around the world improve their infrared analyses. In addition to writing for Spectroscopy, Dr. Smith writes a regular column for its sister publication Cannabis Science and Technology and sits on its editorial board. He earned his PhD in physical chemistry from Dartmouth College. He can be reached at: SpectroscopyEdit@MMHGroup.com ●


MIR Spectroscopy Validates Origin of Premium Brazilian Cachaças
June 11th 2025A recent study published in the journal Food Chemistry explored Brazil’s cachaça industry, focusing on a new analytical method that can confirm the geographic origin of cachaças from the Brejo Paraibano region in Brazil.


Bruce R. Kowalski: The Maverick Mind Behind Chemometrics
June 2nd 2025In this Icons of Spectroscopy article, Executive Editor Jerome Workman Jr. delves into the life and impact of Bruce Kowalski, an analytical chemist whose major contributions to chemometrics helped establish the field of applying advanced quantitative and qualitative mathematics to extract meaningful chemical information from complex datasets. Kowalski’s visionary approach to chemical data analysis, education, and software development has transformed the landscape of modern analytical chemistry for academia and industry.

Ancient Meteorite Reveals Space Weathering Secrets Through Cutting-Edge Spectroscopy
Published: May 27th 2025 | Updated: May 27th 2025Researchers in Rome used advanced spectroscopic techniques to probe the mineralogy of the CM2 carbonaceous chondrite NWA 12184. This revealed the effects of space weathering and provided insights into C-type asteroid evolution.

The Future of Neurodegenerative Disease Research and the Role of IR Imaging
May 21st 2025In the final part of this three-part interview, Ayanjeet Ghosh of the University of Alabama and Rohit Bhargava of the University of Illinois Urbana-Champaign talk about the key performance metrics they used to evaluate their model, and what the future of neurodegenerative disease research looks like.

