Article
Spectroscopy
Spectroscopy
The Use of Raman Spectroscopy for the Identification of Forensically Relevant Body Fluid Stains
Author(s):
This study reveals the ability of Raman spectroscopy to identify some forensically relevant body fluids, both
Raman spectroscopy is fast becoming a popular technique in the forensic science discipline, and more recently its focus has turned to biological samples. This study reveals the ability of Raman spectroscopy to identify some forensically relevant body fluids, both individually and within mixed samples, that can be crucial in some forensic investigations. This study also further demonstrates the capabilities of Raman as a means for human blood identification in simulated crime scene samples to include bloodstains on a variety of fabrics, at varying dilutions, following laundering, and with the use of various blood-enhancement reagents. The impact of washing and blood-enhancement reagents reveals the importance of the choice of method and its bearing on subsequent Raman analysis.
In forensic investigations, determining the identity of an unknown stain can aid both in reconstruction and, if it is a biological stain, identification of an individual. Many suspected body fluid stains are first presumptively identified at the scene, then confirmed in a laboratory setting. However, many of the tests used, both presumptive and confirmatory, consume the sample in question, preventing further analysis, namely DNA profiling. These methods can also be time- and labor-intensive, while producing variable results. Raman spectroscopy has been gaining interest as a new method of body fluid identification, partly because of its nondestructive nature. Prior research has demonstrated that Raman spectroscopy gives a unique spectrum for several body fluids regularly found at crime scenes, while also preserving the sample for DNA analysis (1,2).
Many of the presumptive tests for biological stains are reagent-based, targeting specific components in the body fluid being tested. These are then followed by a second test used to confirm the result of the initial test. In blood, the main component tested for is hemoglobin (3), and if a presumptive positive is found, the Takayama crystal test can be performed (3), although "card" methods are being used more (4). Presumptive testing for semen relies on the presence of seminal acid phosphatases, although these tests can create false positives because of the presence of acid phosphatases in other body fluids (5). These presumptive tests are then checked for the presence of spermatozoa to confirm the presence of semen. The sperm are stained using techniques such as Christmas tree staining (6). If the sample is azoospermic, prostate-specific antigen (PSA) can also be tested for, but this technique is also nonspecific (7). For saliva, presumptive tests are mainly color reaction tests checking for the presence of α-amylase (8). Confirmatory tests for saliva consist of enzyme-linked immunosorbent assays (ELISAs), targeting amylase (9) or statherin (10). Presumptive testing for urine is nonspecific and insensitive (3), but it can prove useful in forensic investigations because DNA has been recovered from urine samples (11). Methods are being developed using messenger RNA (mRNA) (12) and micro RNA (miRNA) (13) as a means of identifying body fluids, both individually and in mixtures. However, there is still a need for a sensitive and specific test to identify biological fluids found on evidence.
Raman spectroscopy has several biological uses outside of forensic science, and it has been used to characterize different biochemical processes in cells (14,15) and identify bacteria to the species level (16). It is currently emerging as a technique in the forensic disciplines because of its nondestructive nature and reagent-free sample preparation (17). Raman also requires minimal amounts of a sample and receives little interference from water molecules, separating it from other forms of vibrational spectroscopy, specifically infrared (IR) spectroscopy (18). Portable Raman spectrometers have further increased the popularity of the technique because it has allowed for testing at a crime scene (19). Raman spectroscopy has been used in the forensic sciences to identify a variety of different materials chemically, including pen inks (20), condom lubricants (21), controlled substances (22), and fabrics (23). For the analysis of biological fluids, Raman spectroscopy has been shown to identify blood (17), semen (24), and saliva (25). Blood and semen were analyzed further, and it was revealed that both could be detected on several different substrates (26,27). It was also shown that blood and semen could be differentiated from each other in mixtures (28).
This research had several aims. First, the aim was to confirm the generation of unique spectra for each of the individual body fluids using Raman spectroscopy. Second, the aim was to determine the ability of the technique to differentiate between two biological fluids in mixed samples. Third, the study aimed to investigate the effects of laundering and enhancement reagents on the Raman spectroscopic signature of human blood in simulated crime scene samples. Finally, the study aimed to investigate the impact of extracting bloodstains from fabric before Raman analysis.
Materials and Methods
Sample Collection
All body fluid samples used in this study were collected after Institutional Review Board (IRB) approval and with the informed consent of the volunteers. Venous blood was collected from the volunteers by a registered phlebotomist. Saliva, semen, and urine were collected by the volunteers themselves using sample collection kits. After the volunteers collected and returned the samples, the kits were stored at 4 °C.
Individual and Mixed Body Fluid Preparation
First, 10 µL of each body fluid sample to be analyzed was placed either directly onto an aluminum foil–covered glass microscope slide or onto a piece of a fabric substrate that was taped to such a substrate. All four body fluids were tested on black cotton and white cotton, with blood being further analyzed on white polyester, black polyester, and denim.
All possible two-component mixtures of the four body fluids were tested, for a total of six different mixtures. Four samples of each mixture were prepared: two samples with the fluids in equal ratios, and one sample of a 1:3 ratio for each fluid in the mixture (that is, 5 µL of blood in 15 µL of semen, and the reverse). Body fluids were mixed before being placed onto the slide. All samples were allowed to dry overnight.
Laundering and Blood-Enhancement Reagents
For the testing involving the blood enhancement reagents, 150 µL of blood was placed in triplicate on six swatches of white cotton fabric and allowed to dry. The swatches were then analyzed using Raman spectroscopy. Afterwards, half of the swatches were washed in the hot water cycle of a washing machine without detergent for 26 min. Those swatches were reanalyzed using Raman spectroscopy. Following this, one unwashed and one washed swatch were treated with one of three blood enhancement reagents: leuco crystal violet (LCV), Coomassie blue, or luminol. After drying overnight, these samples were once more analyzed using Raman spectroscopy.
Extraction of Stains from Fabric
The evaluation of the extraction method involved the testing of six volumes of blood (10, 50, 100, 150, 200, and 250 µL) on five substrates (white cotton, black cotton, white polyester, black polyester, and denim). After drying, the stains were cut from the fabric and placed into a centrifuge tube. Deionized water was added to the tube based on the size of the stain, and the tube was shaken until the fabric was completely wet. The fabric was then placed into a spin basket, and the tube was centrifuged at 14,000 rpm (20,817 rcf) for approximately 2 min. For the 200- and 250-µL volumes, the stains were cut in half, prepared in separate tubes, and recombined after being centrifuged. Two dilutions, 1:10 and 1:100, were also tested, and were prepared in the same manner on all five substrates. The stains treated with the enhancing reagents were extracted in the same manner. Then 10 µL of all the resulting samples was placed on microscope slides as described above.
Raman Spectroscopy Analysis
All samples were analyzed using a DXR Raman microscope (Thermo Scientific) equipped with a 10× objective and Thermo Scientific OMNIC software. A 780-nm laser was used, and kept at a constant power of 10 mW. The spectrometer aperture was a 50-µm slit and a 400-line/mm grating was used.
Five spectra were collected from different areas of each sample, with each analysis consisting of five 20-s exposures. Areas of neat substrate were also analyzed to collect spectra representative of the fabrics used
Data Analysis
The five runs from a single sample were then averaged using the OMNIC software to create the sample average. Any spectra requiring baseline corrections were manually corrected, also using the software. Spectral subtractions were performed by exporting to GRAMS/AI 7.01 and using that software for the subtraction. The extracted samples were compared to a library reference created in OMNIC, using a correlation algorithm that gave "match" scores.
Results and Discussion
Identification of Individual and Mixed Body Fluids
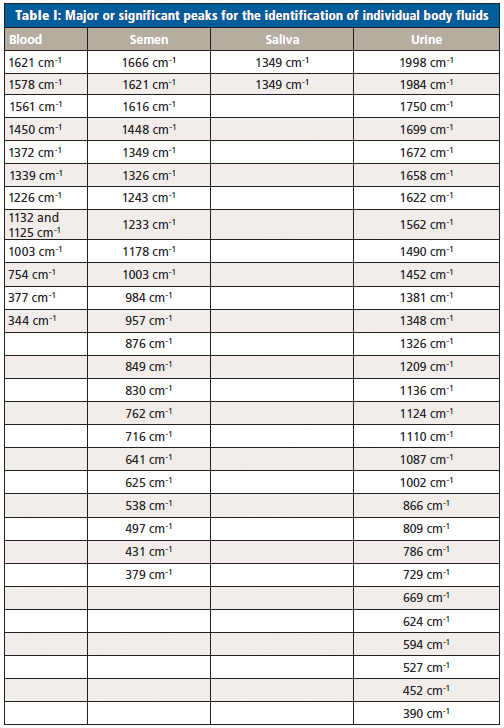
The individual body fluids tested were differentiated from each other, with the body fluid average spectra shown in Figure 1. Three of the four body fluid spectra contained peaks that were not present in the other fluids, as shown in Table I. Saliva could not be identified by its Raman spectrum because there was only one peak (at 1349 cm-1) detected in the four different saliva samples. This peak was also found in the spectra of urine and semen. This result is not in agreement with previously published research (25). Identification of a material by one peak alone is not acceptable; thus classification of this body fluid by Raman spectroscopy is not possible. Consequently, saliva was removed from further data analyses. It was noted that although the urine samples gave characteristic spectra, there was a larger amount of variability within samples than with the other body fluids.

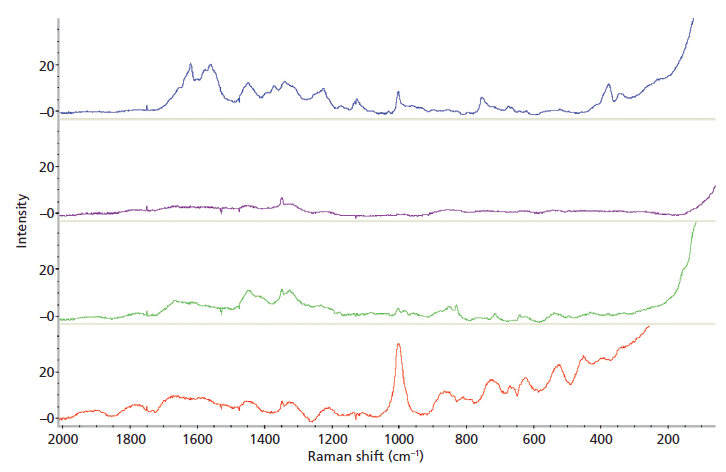

Figure 1: Average Raman spectra of blood (blue), saliva (purple), semen (green), and urine (red).
Eight of the nine mixture samples, made from three concentrations of the two body fluid components (blood–semen, blood–urine, and semen–urine), were identifiable. Identification was made by the presence of the characteristic peaks for each body fluid (Table I). For the blood–semen mixtures at 1:1 and 1:3 ratios, both components were identified although semen's major peaks were masked by the blood spectra, however the minor peaks were present. Semen was not identified in the blood–semen mixture at the 3:1 dilution. For the blood–urine mixture at all concentration, both components were identified. Similar to the blood–semen mixtures, urine's major peaks were masked by the blood spectra; however, the minor peaks were visible. Both components of the semen–urine mixture were identified from the mixture spectra at all three dilutions. It is important to note that these identifications took place under ideal laboratory conditions, and the identities of the components in the mixtures were known. For identification of unknown samples, the creation of a thorough database would be required.

The Impact of Fabric Substrate
The substrate testing revealed that semen and urine were not identified on black cotton or white cotton. The signals from the substrates were too strong for the signals of the body fluids to be detected, resulting in indeterminate results of spectral subtraction. Furthermore, none of the mixtures were identified on either of the substrates tested for the same reasons.
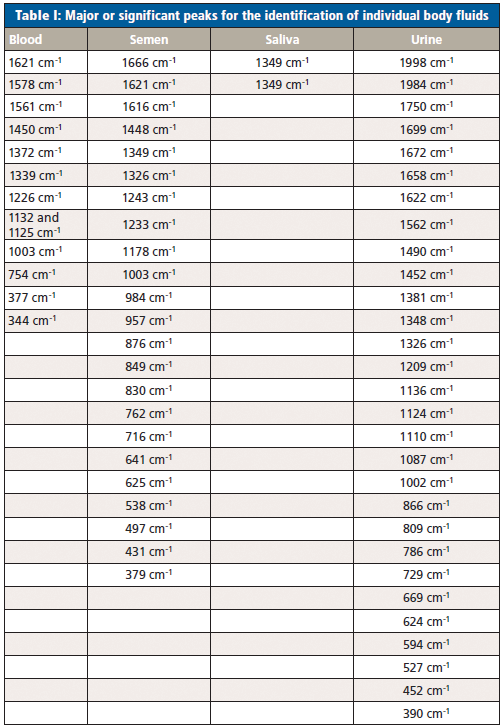
Blood was tested on five different substrates, and was identified on two: white cotton (Figure 2) and white polyester. The darker dyes in the denim, black cotton, and black polyester created a large amount of fluorescence and interference that masked the blood signal. The signal retrieved using spectral subtraction on the two lighter substrates was rather weak, but possessed several of the major peaks associated with venous blood.


Figure 2: Raman spectral subtraction results for blood on white cotton.
The Impact of Diluted Blood
The Raman analysis of the wet and dry dilution series revealed that blood diluted beyond a 1:100 ratio could not be detected, and the diluted blood could be detected only when dry (Figure 3). With each successive dilution, the peaks in the spectra became less intense and began to lose their characteristic shape. Only the neat blood sample was detected while wet, and the signal had significantly more noise than the dried samples.

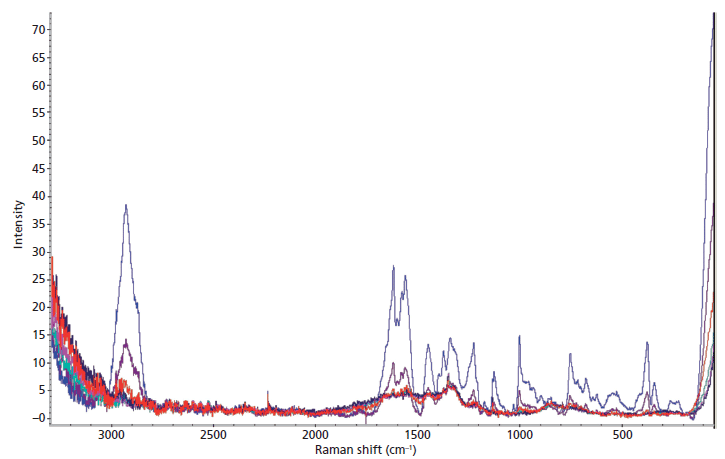

Figure 3: The average Raman spectra of the dried dilution series of blood stains, including whole blood (blue), 1:10 dilution (purple), 1:102 dilution (red), 1:103 dilution (green), 1:104 dilution (pink), and 1:105 dilution (navy blue).
The Impact of Laundering and Blood-Enhancement Reagents
The results of the washing and subsequent enhancement of blood stains revealed that laundered blood stains do not produce a Raman signal strong enough to be detected, and the further enhancement of the blood stains, while giving presumptive positives for the laundered samples, do not aid in recovering the Raman signal. All the initial stains produced spectra consistent with venous blood after spectral subtraction was used to remove the underlying fabric. All laundered samples did not produce any signals consistent with the venous blood reference spectrum. This result is consistent with the dilution results because anything less than 1:100 would not have produced a detectable Raman spectrum. Post-enhancement, only the unwashed samples treated with luminol returned Raman spectra consistent with the venous blood reference (Figure 4). Any laundered samples or samples treated with the LCV or Coomassie blue possessed too much interference or too weak of a blood signal to allow for detection. The samples extracted from the unwashed blood stains treated with LCV and luminol were shown to have spectra consistent with venous blood, allowing for the identification of more samples than the subtraction method.


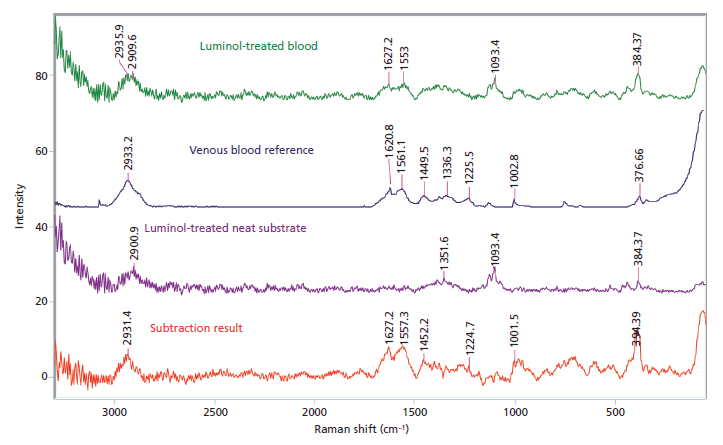
Figure 4: Raman spectral subtraction results for an unwashed bloodstain on white cotton treated with luminol.
The Impact of Extracting Bloodstains from Fabric Before Analysis
The extraction method proved to be moderately successful, in that the venous blood library reference spectrum was provided by the correlation library search as the first match for 87 of the 90 neat blood samples that were tested on all five substrates at all six volumes. Of the three samples not identified, each had something other than venous blood as the highest match, and two had blood as the second most likely substance. Furthermore, two of the three false negatives occurred in samples extracted from black polyester, and the third in a sample from denim. Thus, the misidentification by the library may have been caused by the substrates they were extracted from, because it was noted under the microscope that small fibers of the fabrics had passed through the spin basket and were present in the sample. These fibers may have introduced some interference, leading to the incorrect identifications. In addition, the hit quality itself was quite poor for all 90 spectra, with hit qualities ranging from 29.32 to 44.68. The low match scores likely resulted from the decreased intensity of peaks caused by the inherent dilution required for the extraction to occur.
Conclusions>
This research highlights the potential of Raman spectroscopy for body fluid identification, and further demonstrates the importance of taking into consideration the impact certain crime scene variables have on the ability of the method to correctly identify body fluids. This research has shown that Raman spectroscopy is capable of the nondestructive identification of some forensically relevant body fluids both individually, and in mixed samples, prepared in laboratory conditions. In forensic investigations, however, body fluids are rarely found in pristine conditions and it is crucial that the method is tested on simulated crime scene samples. Body fluids are typically recovered on various substrates, such as clothing, where the body fluids may be diluted or the fabric washed or laundered. This study revealed the impact that various fabric substrates and certain colored substrates have on the ability of Raman to correctly identify certain body fluids. Evidence items that are suspected to have latent bloodstains are typically sprayed with a presumptive blood-enhancement reagent. This study tested Raman's sensitivity by assessing diluted blood samples, revealing blood dilutions up to 1:100 to be detectable using Raman spectroscopy. All samples tested after laundering were not detectable, suggesting the blood had been diluted greater than 1:100 in the laundering process. The application of commonly used presumptive blood-enhancement reagents revealed luminol to have no impact on the ability of Raman to correctly identify unwashed blood samples. This is important information to understand when determining an analytical scheme for the analysis of a suspected body fluid both at a crime scene and in the forensic laboratory. Furthermore, it was also shown that although extracting the body fluids from the substrates may be an alternative to spectral subtraction, additional research is needed to find a method to obtain more robust signals for library searching or another method for comparison and subsequent identification. The use of Raman spectroscopy for body fluid identification is indeed a hot topic and keen area of research and it is crucial that the research, such as the study discussed in this article, addresses the real-world applications of the method.
Acknowledgments
The authors would like to thank the Summer Undergraduate Research Fellowship program at the University of New Haven for supporting this work.
References
(1) V. Sikirzhytski, K. Virkler, and I.K. Lednev, Sensors (Basel) 10(4), 2869–2884 (2010). http://doi:10.3390/s100402869
(2) K. Virkler and I.K. Lednev, Forensic Sci Int 181(1–3), e1–5 (2008). http://doi:10.1016/j.forsciint.2008.08.004
(3) J.M. Taupin and C. Cwiklik, Scientific Protocols for Forensic Examination of Clothing (CRC Press, Boca Raton, Florida, 2010), pp. 123–143.
(4) M.J. Grubb, in Cold Case Homicides: Practical Investigative Techniques, R.H. Walton (CRC Press, Boca Raton, Florida, 2006), pp. 317–335.
(5) R.E. Gaensslen, National Institute of Justice, Sourcebook in Forensic Serology, Immunology, and Biochemistry. xxix, p. 692 (U.S. Department of Justice, National Institute of Justice, Washington, D.C.). Available at: https://www.ncjrs.gov/pdffiles1/pr/160880_unit_3.pdf.
(6) R.C. Shaler, in Forensic Science Handbook, Volume II, 2nd Edition, R. Saferstein, Ed. (Prentice-Hall, Upper Saddle River, New Jersey, 2002), pp. 525–613.
(7) S. Schmidt, M. Franke, J. Lehmann, T. Loch, M. Stöckle, and K. Weichert-Jacobsen, Urology 57(4), 717–720 (2001). http://doi.org/10.1016/S0090-4295(00)01093-1.
(8) J.R. Myers and W.K. Adkins, J. Forensic Sci. 53(4), 862–867 (2008). http://doi.org/10.1111/j.1556-4029.2008.00755.x.
(9) L. Quarino, Q. Dang, J. Hartmann, and N. Moynihan, J. Forensic Sci. 50(4), 873–876 (2005).
(10) T. Akutsu, K. Watanabe, Y. Fujinami, and K. Sakurada, J. Leg. Med. 124(5), 493–498 (2010). http://doi.org/http://dx.doi.org.unh-proxy01.newhaven.edu:2048/10.1007/s00414-009-0391-2.
(11) T. Nakazono, S. Kashimura, Y. Hayashiba, K. Hara, A., Matsusue, and C. Augustin, J. Forensic Sci. 53(2), 359–363 (2008). http://doi.org/10.1111/j.1556-4029.2008.00675.x.
(12) Y. Xu, J. Xie, Y. Cao, H. Zhou, Y. Ping, L. Chen, and Z. Zhao, PLoS ONE 9(7) e100123 (2014). http://doi.org/10.1371/journal.pone.0100123.
(13) M.L. Uchimoto, E. Beasley, N. Coult, E.J. Omelia, D. World, and G. Williams, Forensic Sci. Int.: Genet. 7(4), 418–421 (2013). http://doi.org/10.1016/j.fsigen.2013.04.006.
(14) J.W. Chan, in The Microflow Cytometer, F.S. Ligler and J.S. Kim, Eds. (Pan Stanford Publishing, Singapore, 2010), Chap. 15.
(15) F. Pascut, A. Downes, and I Notingher, in Optical Techniques in Regenerative Medicine, S.P. Morgan, F.R.A.J. Rose, and S.J. Matcher, Eds. (Taylor & Francis Group, Boca Raton, Florida, 2013), pp. 205–236.
(16) P.C. Buijtels, H.F. Willemse-Erix, P.L. Petit, H.P. Endtz, G.J. Puppels, H.A. Verbrugh, A. van Belkum, D. van Soolingen, and K. Maquelin, J. Clin. Microbiol. 46(3), 961–965 (2008). http://doi.org/10.1128/JCM.01763-07.
(17) K. Virkler and I.K. Lednev, Anal. Bioanal. Chem. 396(1), 525–534 (2010). http://doi.org/10.1007/s00216-009-3207-9.
(18) J.G. Grasselli, M.K. Snavely, and B.J. Bulkin, Chemical Applications of Raman Spectroscopy (John Wiley and Sons Ltd., New York, New York, 1981).
(19) B.A. Eckenrode, E.G. Bartick, S.D. Harvey, M.E. Vucelick, B.W. Wright, and R.A. Huff, Portable Raman Spectroscopy Systems for Field Analysis (Forensic Science Communications). Retrieved July 28, 2015, from https://www.fbi.gov/about-us/lab/forensic-science-communications/fsc/oct2001/eknrode.htm (2001).
(20) I. Geiman, M. Leona, and J.R. Lombardi, J. Forensic Sci.54(4), 947–952 (2009). http://doi.org/10.1111/j.1556-4029.2009.01058.x.
(21) J. Wolfe and D.L. Exline, J. Forensic Sci. 48(5), 1065–1074 (2003).
(22) V. Rana, M.V. Cañamares, T. Kubic, M. Leona, and J.R. Lombardi, J. Forensic Sci. 56(1), 200–207 (2011). http://doi.org/10.1111/j.1556-4029.2010.01562.x.
(23) P. Buzzini and G. Massonnet, J. Forensic Sci. 58(6), 1593–1600 (2013). http://doi.org/10.1111/1556-4029.12298.
(24) K. Virkler, and I.K. Lednev, Forensic Sci. Int.193(1–3), 56–62 (2009). http://doi.org/10.1016/j.forsciint.2009.09.005.
(25) K. Virkler and I.K. Lednev, The Analyst 135(3), 512–517 (2010). http://doi.org/10.1039/b919393f.
(26) G. McLaughlin, V. Sikirzhytski, and I.K. Lednev, Forensic Sci. Int. 231(1–3), 157–166 (2013). http://doi.org/10.1016/j.forsciint.2013.04.033.
(27) G. McLaughlin and I.K. Lednev, J. Forensic Sci. 60(3), 595–604 (2015). http://doi.org/10.1111/1556-4029.12708.
(28) V. Sikirzhytski, A. Sikirzhytskaya, and I.K. Lednev, Forensic Sci. Int. 222(1–3), 259–265 (2012). http://doi.org/10.1016/j.forsciint.2012.07.002.
Tyler Schlagetter, Brooke W. Kammrath, and Claire L Glynn are with the Department of Forensic Science in the Henry C. Lee College of Criminal Justice and Forensic Science at the University of New Haven in West Haven, Connecticut. Direct correspondence to: cglynn@newhaven.edu


Newsletter
Get essential updates on the latest spectroscopy technologies, regulatory standards, and best practices—subscribe today to Spectroscopy.