

News|Articles|September 8, 2026
Advancements and Applications in FT-IR Spectroscopy
Author(s)Will Wetzel
Fact checked by: Jerome Workman, Jr.
In this Q&A, we explore the advanced techniques, methods, and real-world applications of FT-IR spectroscopy.
Advertisement
Fourier transform infrared (FT-IR) spectroscopy is an essential, non-destructive analytical tool that measures molecular vibrations to provide rapid qualitative and quantitative chemical characterization.1,2 Today, advanced FT-IR methods and chemometrics solve complex challenges in pharmaceuticals, food science, environmental monitoring, and medicine, among other applications.
In this Q&A, we explore the advanced techniques, methods, and
What are the fundamental principles of FT-IR, and what advantages does it offer over older dispersive instruments?
FT-IR spectroscopy measures how polar covalent bonds (such as C=O, O–H, and N–H) absorb infrared (IR) light during vibrational transitions.2 Instead of scanning wavelengths sequentially, an FT-IR spectrometer passes broadband light through a Michelson interferometer.2 A moving mirror produces an interferogram encoding all frequencies simultaneously, which a fast Fourier transform (FFT) algorithm converts into a spectrum.2
This approach yields three major advantages over dispersive systems highlighted below:
- Fellgett’s (multiplex) advantage: Measuring all wavelengths simultaneously boosts the signal-to-noise ratio and collection speed.2
- Jacquinot’s (throughput) advantage: The absence of narrow slits delivers much higher energy throughput.2
- Connes’ advantage: High-precision wavelength calibration is maintained using a stable internal laser reference.2
What are the primary sampling configurations used in modern FT-IR analysis?
Modern FT-IR instruments feature several new configurations tailored to specific sample matrices. These configurations include the following:
- Transmission: Passes light directly through thin films, gas cells, or KBr pellets, requiring careful thickness control.2,3
- Attenuated Total Reflectance (ATR): Guides the IR beam through a crystal (like diamond or ZnSe) at the sample interface. With a 1–2 µm penetration depth, it allows direct, preparation-free analysis of solids, liquids, and gels.2,4
- Diffuse Reflectance (DRIFTS): Gathers scattered light from powders and rough surfaces, making it ideal for catalysts, soils, or asphalt binders.1,2
- Specular Reflection and Microspectroscopy (µ-FT-IR): Enables surface analyses of thin films and micro-scale particles like environmental microplastics.2
How is the food industry utilizing FT-IR to detect adulteration and verify origins?
We are also seeing FT-IR spectroscopy being combined with chemometric methods to aid in the detection of food adulteration, a growing challenge in the current global economy. There are clear benefits of this technological integration. For one, FT-IR paired with chemometrics enables high-throughput food screening and authentication. As an example, diffuse reflectance (DRIFTS) with support vector machine-discrimination analysis (SVM-DA) detects and quantifies low-cost cassia, black pepper, or clove in high-value cinnamon.1 Another recent example is that benchtop FT-IR with data-driven soft independent modeling of class analogy (DD-SIMCA) identifies allergenic nutshells in cumin powder.1
For origin authentication, there are a few recent examples that can be highlighted. In one example, ATR FT-IR with partial least squares discriminant analysis (PLS-DA) discriminated carrot varieties to verify Protected Geographical Indication specialties.1 Similarly, FT-IR fingerprinting with
Mixtures are complex. What advanced methods does FT-IR employ to resolve them?
Analyzing mixtures is challenging because traditional spectral subtraction often accumulates noise and fails during environmental shifts. Modern FT-IR overcomes this through two methods: spatial separation (IR microscopy) and spectral separation (multicomponent searching).
So how do these two methods work? In spatial separation, imaging microscopes collect spectral images at high resolution (25 µm).4 Software digitizes these images to calculate area percentages, enabling calibration-free, semiquantitative mapping of components in granular mixtures like pharmaceutical tablets.4 In spectral separation, programs like OMNIC Specta conduct cumulative searches of composite spectra without subtraction, accurately identifying constituents in additive gaseous or homogeneous solid mixtures.4
How is FT-IR used in clinical diagnostics and biophysics?
FT-IR is regularly used in clinical diagnostics and biophysics because of its ability to provide label-free, non-invasive screening of biofluids.1,5–7 In diabetes research, FT-IR spectroscopy tracks red blood cell (RBC) membrane remodeling. Protein secondary structure is monitored via the amide I (1600–1700 cm⁻¹, C=O stretching) and amide II (1500–1600 cm⁻¹, N-H bending/C-N stretching) bands.5 Under diabetic stress, membrane proteins misfold, shifting from ordered α-helices to rigid β-sheets.5
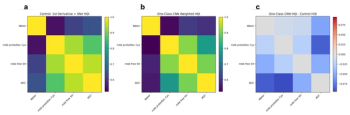
To detect these subtle changes in whole cells without isolating membranes, researchers apply second-derivative processing to sharpen overlapping peaks and eliminate baseline drift.5,6 Paired with orthogonal partial least squares discriminant analysis (oPLS-DA) and Variable Importance in Projection (VIP) scoring, these features establish biomarkers to stage diabetes progression in intact RBCs.6 In nanotechnology, transmission-mode FT-IR and second-derivative curve-fitting similarly track structural stability and protein intercalation in α-lactalbumin-infused nickel hydroxide nanoparticles.43
What role does FT-IR play in environmental monitoring?
FT-IR spectroscopy has also been used for remote sensing of atmospheric greenhouse gases like carbon dioxide and methane in open-path or extractive setups.1,2 Additionally, micro-FT-IR (µ-FT-IR) is a standardized tool to detect microplastics in water and sediment.1,2 Coupling raw spectra with one-dimensional (1D) convolutional neural networks (CNNs) achieves up to 97.44% classification accuracy for environmental microplastics.1
References
- Workman, Jr., J. A Review of the Latest Research Applications Using FT-IR Spectroscopy. Spectrosc. Suppl. 2024, 39 (s8), 22–28. DOI:
10.56530/spectroscopy.ak9689m8 - Workman, Jr., J. FT-IR Spectroscopy Mini-Tutorial: Principles, Practice, and Applications Across Disciplines. Spectroscopy 2026, 41 (1), 36–39. DOI:
10.56530/spectroscopy.gm5083p5 - Selvaraj, E. J.; Lakshmanan, P. UV–FT-IR Studies on α-Lactalbumin-Infused Nickel Hydroxide Nanoparticles. Spectroscopy Online, 2026.
https://www.spectroscopyonline.com/view/uv-ft-ir-studies-on--lactalbumin-infused-nickel-hydroxide-nanoparticles (accessed September 1, 2026). - Bradley, M.; Izzia, F.; Nunn, S. Analysis of Mixtures by FT-IR: Spatial and Spectral Separation of Complex Samples. Spectrosc. Suppl. 2008, 23 (s8). Available at:
https://www.spectroscopyonline.com/view/analysis-mixtures-ft-ir-spatial-and-spectral-separation-complex-samples - Marzac, K.; Perez-Guaita, D.; Wajda, A.; Wilk, A.; Wilkosz, N.; Chwiej, J.; Chodaczek, G.; Chasse, J. Sex- and Age-Dependent Red Blood Cell Remodeling in Type 2 Diabetes Revealed by FT-IR and Raman Spectroscopy: Part I. Spectroscopy Online, 2026.
https://www.spectroscopyonline.com/view/sex--and-age-dependent-red-blood-cell-remodeling-in-type-2-diabetes-revealed-by-ft-ir-and-raman-spectroscopy-part-i (accessed September 1, 2026). - Marzac, K.; Perez-Guaita, D.; Wajda, A.; Wilk, A.; Wilkosz, N.; Chwiej, J.; Chodaczek, G.; Chasse, J. Sex- and Age-Dependent Red Blood Cell Remodeling in Type 2 Diabetes Revealed by FT-IR and Raman Spectroscopy: Part II. Spectroscopy Online, 2026.
https://www.spectroscopyonline.com/view/sex--and-age-dependent-red-blood-cell-remodeling-in-type-2-diabetes-revealed-by-ft-ir-and-raman-spectroscopy-part-ii (accessed September 1, 2026). - Marzac, K.; Perez-Guaita, D.; Wajda, A.; Wilk, A.; Wilkosz, N.; Chwiej, J.; Chodaczek, G.; Chasse, J. Sex- and Age-Dependent Red Blood Cell Remodeling in Type 2 Diabetes Revealed by FT-IR and Raman Spectroscopy: Part III. Spectroscopy Online, 2026.
https://www.spectroscopyonline.com/view/sex--and-age-dependent-red-blood-cell-remodeling-in-type-2-diabetes-revealed-by-ft-ir-and-raman-spectroscopy-part-iii (accessed September 1, 2026).
Advertisement
Related Content
Advertisement


Advertisement
Advertisement