SPEC PerkinElmer 11.10
News|Articles|November 5, 2026

Highly Substituted Benzene Rings—The Rest of the Story II: Spectra

This column, the second installment on highly substituted benzene rings, shows that tri- and tetra-substituted substitution patterns can be distinguished by whether the ring bending peak is present and by the position of the in-phase aryl C-H wagging peak, which shifts according to how many adjacent hydrogens the ring carries.

In this second installment of our discussion of the spectra of highly substituted benzene rings, we look at the spectra of tri- and tetra-substituted rings. We see that the keys to distinguishing between the different substitution patterns is the presence or absence of the ring bending peak and the position of the in-phase aryl C-H wagging peak. This latter peak position depends upon the number of hydrogens that are next to each other for a given substitution pattern.

This is the second installment of our discussion of the structures and spectra of highly substituted benzene rings. Here, highly substituted means benzene rings that have three, four, or five substituents on them. Benzene rings are a type of aromatic ring, of which there are many varieties and which will be the topic of future columns. So far, we have restricted our examination of the spectra of aromatic rings to substituted benzenes because they are very common, and frankly, have the simplest spectra. In past articles I discussed the spectra of mono- and di-substituted benzene rings.1–3 Last time we discussed the peak positions of highly substituted benzene rings.4 Here, we look at their spectra.

Peak Position Review

The substitution pattern around benzene rings is determined from their infrared spectra by the presence or absence of the ring bending mode at 690±10 cm-1 (going forward all peak positions will be in cm-1 units even if not noted) and the position of the C-H wagging peaks.4 Recall that the most intense C-H bending peak occurs when all the adjacent hydrogens on a ring bend in-phase with each other as seen in Figure 1.

Note that there are vibrations involving 5-adjacent, 4-adjacent, 3-adjacent, 2-adjacent, and what are called lone hydrogens, and that these vibrations involve the adjacent hydrogens wagging in-phase with each other above and below the plane of the ring (“wagging” is a simpler term for an out-of-plane bend). The peaks from these vibrations are properly called the “aryl adjacent in-phase C-H wags” but throughout the rest of this article I will simply refer to them as “C-H wags”. The C-H wagging peaks then for any particular substitution pattern are determined by the number of adjacent hydrogens. For example, toluene has a peak due to 5-adjacent hydrogens bending in-phase, whereas pentamethyl benzene has a lone hydrogen and hence a different C-H bending peak position. The position of the C-H bending peak goes up as the number of adjacent hydrogens bending together goes down as seen in Table 1.

We can use Table 1 to understand the spectra, for example, of the tri-substituted benzene rings seen in Figure 2.

Based on Table 1 then, the 1,2,3- isomer has three adjacent hydrogens and will have a C-H wagging peak from 810 to 750, the 1,2,4- isomer has two adjacent hydrogens and will have a peak from 860 to 790, and the 1,3,5- isomer has lone hydrogens only so will have a peak from 900 to 860. Using the known structures of substituted benzene rings and Table 1 we can construct Table 2, which shows the presence or absence of the ring bend and the position of the C-H wag for different substituted benzenes.

Note that Table 2 can be used for identifying everything from benzene itself up to a penta-substituted molecule. I omitted hexa-substituted benzenes because they have aryl C-H bond to give a wagging peak.

Note it Table 2 that only four of the isomers exhibit the ring bend peak, notably the mono-, meta-, 1,2,3- , and 1,3,5- isomers. As discussed previously,1,2,3 this is because depending upon the substitution pattern the value of dμ/dx (the change in dipole moment with respect to bond distance during a vibration) for the ring bend is either large or zero.

The Spectra of Tri-Substituted Benzene Rings

Since the relevant peaks for distinguishing benzene rings from each other are at low wavenumber, the spectra we will look at will be displayed from 1000 to 600. The infrared spectra of the three trimethyl benzene isomers are seen in Figure 3.

The spectrum of 1,2,3-trimethyl benzene is seen at the top of Figure 3. Note from its structure that it has three adjacent hydrogens, and that its C-H wag is at 765 as predicted by Table 1. Also note that the 1,2,3-isomer does have a ring bend, in this case at 707 and which is generally found from 725 to 680.

The middle spectrum in Figure 3 is of the 1,2,4- isomer. Note that it has two adjacent hydrogens and a lone hydrogen, hence it has two C-H wagging peaks. The peak at 804 is the 2-adjacent wag, generally found between 860 and 800, and the smaller peak at 871 is the lone hydrogen wag typically seen from 900 to 860. This isomer does not exhibit the ring bending peak. Note that there are two C-H wagging peaks here, one for the 2-adjacent hydrogens and the other for the lone hydrogen.

The bottom spectrum in the figure is of the 1,3,5- isomer. The spectrum of this isomer is unique because it has lone hydrogens only giving rise to a C-H wag peak here at 868, and it also a ring bend peak at 705. The spectrum of the 1,3,5- isomer is unique amongst the substituted benzene rings because it is the only one to have a lone C-H wagging peak combined with a ring bend. The ranges for these two peaks for the 1,3,5- isomer are 900 to 860 and 710 to 650.

The Spectra of Tetra-Substituted Benzene Rings

The infrared spectra of the three tetra-methyl benzene isomers are seen in Figure 4.

The top spectrum in Figure 4 is of the 1,2,3,4- isomer. Note it has two adjacent hydrogens and hence a 2-adjacent wagging peak at 801, which is generally found from 860 to 800. The 1,2,3,5- isomer has lone hydrogens only so has a 1-adjacent peak at 846. The 1,2,4,5- isomer also has lone hydrogens only and its C-H wagging peak is seen in the bottom spectrum in the figure at 866. Note that none of the tetra-substituted isomers exhibit the ring bending peak.

Benzene Fingers Peaks

As we have discussed previously,3 for mono- and disubstituted benzene rings there is a series of weak overtone and combination bands2 between 1650 and 2000 that is sensitive to the ring’s substitution pattern. In the literature,5 these peaks are called the “summation bands” but I prefer to call them the “benzene fingers” because they look like a series of little fingers sticking up out of the spectrum. As a brief review, the benzene fingers for mono-, ortho-, meta-, and para- substituted rings are shown in Figure 5.

Note that for toluene there are four evenly spaced peaks, for ortho- there are four squished together peaks, for meta- there are three peaks, ,and four para- there are two peaks. Figure 5 can be used when Table 2 is ambivalent about a benzene ring’s substitution pattern.

Not surprisingly then, tri- and tetra- substituted rings can also be distinguished from each other using the patterns of their benzene fingers. The benzene fingers for 1,2,3-, 1,2,4-, and 1,3,5,- substituted rings are shown in Figure 6.

Note that the 1,2,3- substitution pattern has 4 well separated peaks, the 1,2,4- ring has two well separated peaks, and 1,3,5- isomer has two squished together peaks. Figure 6 can be used in addition to Table 2 to help distinguish tri-substituted benzene rings from each other.

Figure 7 shows the benzene fingers for tetra-substituted benzene rings.

Note that all three substitution patterns have two benzene finger peaks. The 1,2,3,5- and 1,2,4,5- patterns are unfortunately very similar, with the two peaks about the same distance apart. However, for the 1,2,3,4- isomer the pair of peaks is closer together. Figure 7 can be used in combination with Table 2 to distinguish tetra-substituted benzene rings from each other.

Conclusions

Benzene rings come in many different substitution patterns. Key peaks in distinguishing the different rings from each other is the presence or absence of the ring bend at about 690, and the position of the in-phase adjacent aryl C-H wag. This latter peak’s position depends upon the number of adjacent hydrogen’s in a molecule’s structure. Benzene rings also exhibit a series of weak overtone and combination bands that I have dubbed the “benzene fingers” whose patterns are sensitive to the substitution pattern around a ring. Ultimately, the 690 band, C-H wagging peak, and benzene fingers patterns together are used to distinguish mono-, di-, tri-, and tetra- substituted benzene rings from each other.

Infrared Spectral Interpretation Workshop Problem

In many of my early columns, I featured problem spectra that readers could work on, and then we would go over the solution to these problems in the next column. This feature has returned after a well-deserved vacation. Look at the spectrum in Figure 8 and do your best to assign the peaks, determine what functional groups are present, and put them together to make up a complete chemical structure. Hint 1: Read the caption. Hint 2: Now that we are in the Advanced Topics universe, any functional group we have ever studied is now fair game. The spectral region from 1650 to 2000 has been expanded as in insert in the upper right hand corner for clarity.

References
  1. Smith, B. C. Distinguishing Structural Isomers: Mono- and Disubstituted Benzene Rings. Spectroscopy 2016, 31 (5), 36–39. Available at: https://www.spectroscopyonline.com/view/distinguishing-structural-isomers-mono-and-di-substituted-benzene-rings
  2. Smith, B. C. The Benzene Fingers, Part I: Overtone and Combination Bands. Spectroscopy 2016, 31 (7), 30–34. Available at: https://www.spectroscopyonline.com/view/benzene-fingers-part-i-overtone-and-combination-bands
  3. Smith, B. C. The Benzene Fingers, Part II: Let Your Fingers Do the Walking Through the Benzene Fingers. Spectroscopy 2016, 31 (9), 30–33. Available at: https://www.spectroscopyonline.com/view/benzene-fingers-part-ii-let-your-fingers-do-walking-through-benzene-fingers
  4. Smith, B. C. Substituted Benzene Rings—The Rest of the Story, Part I: Peak Positions. Spectroscopy 2026, 41 (4), 12–15. Available at: https://www.spectroscopyonline.com/view/substituted-benzene-rings-the-rest-of-the-story-i-peak-positions
  5. Smith, B. C. Infrared Spectral Interpretation: A Systematic Approach, CRC Press, Boca Raton, 1999.


Related to this article

Spectral Frontiers: Seeing the Unseeable Microspectroscopy
Microspectroscopy, the marriage of spectroscopic chemical identification with microscopic spatial resolution, has advanced from Perkin-Elmer's first commercial infrared microspectrometer in 1953 to today's nanoscale AFM-IR probes, synchrotron-brightness infrared beamlines, and compact hyperspectral tissue imaging devices being developed for AI-assisted cancer detection.
Tutorial Tuesday: When to Use Infrared Spectroscopy
In this “Tutorial Tuesday” clip, Peter Larkin, who is a Manager of Spectroscopy, Thermal Analysis, and Chromatography at Syensqo, highlights how people use the method or technique that they are comfortable with, even if it’s not the best one to use.
Spectroscopy Top 10 DOI Articles of the Month (September 2026)
The following articles are the most accessed digital object identifier (DOI) manuscripts for Spectroscopy and LCGC International during the month of September 2026. Nine articles are individually ranked here by DOI page views; the third-highest entry (186 views) was recorded against the bare journal-level DOI rather than an individual article and is therefore not attributable to a single manuscript.
Monitoring Sugar Consumption and Ethanol Production During Yeast Fermentation Using a Raman Plate Reader and Multivariate Analysis
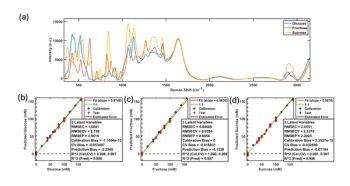
This column shows that a Raman plate reader paired with partial least squares regression can simultaneously quantify glucose, fructose, sucrose, and ethanol in yeast fermentation samples, using turbidity-matched calibration standards to correct for yeast-induced turbidity, and offers a rapid, label-free, high-throughput method for tracking sugar consumption and ethanol production in strain screening, media optimization, and process development.
Healthcare administrator reviewing an insurance policy schedule with a stethoscope on a clipboard, health insurance coverage, medical underwriting, prior authorization, and patient claims processing. | Image Credit: Joi_studio - stock.adobe.com
In a SciX interview, Marc Porter covered a lot of ground, from a student-driven pivot into immunoassays to a baseball analogy for Stokes and anti-Stokes scattering, and shares the open questions he is still chasing.