
In this interview clip, Kristin L. Wustholz of William & Mary explains how her group judges the fidelity of its blinking-based classifications, why real artworks will call for classification libraries, and where the method fits alongside SERS.
Multiple reflection ATR is ideal for detecting miniscule levels of components in solutions, both aqueous and non-aqueous. Most multiple ATR accessories use ATR crystals which are susceptible to wear and damage. Diamond, although an excellent choice due to its refractive index, high degree of chemical inertness, and low coefficient of friction, is generally not used because of its expense and its strong lattice bands around 2200 cm-1.
S.L. Berets1, M. Nassar1, and M. Milosevic2, 1Harrick Scientific Products, Inc. and 2MEV Photonics
Multiple reflection ATR is ideal for detecting miniscule levels of components in solutions, both aqueous and non-aqueous. Most multiple ATR accessories use ATR crystals which are susceptible to wear and damage. Diamond, although an excellent choice due to its refractive index, high degree of chemical inertness, and low coefficient of friction, is generally not used because of its expense and its strong lattice bands around 2200 cm-1. However, by using a small ATR crystal and a short pathlength through the crystal, as is commonly done with single reflection diamond ATR accessories, these effects can be minimized. This note explores the use of a multiple reflection diamond ATR accessory to distinguish between several different aqueous liquids by examining low concentration functional groups.
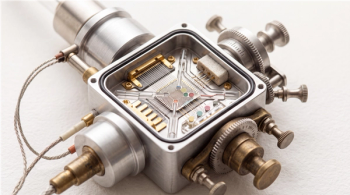
Harrick Diamond ConcentratIR™ (see Figure 1), which supplies seven reflections from the sample, was installed and aligned in a commercial FT-IR spectrometer. Spectra were collected at an 8 cm-1 resolution and signal averaged over 64 scans. Three different eye drops were examined: Visine®, Sun Mark®, and Patanol®. A single drop of each was placed on the ATR crystal for analysis.
Figure 1: ConcentratIR⢠multiple reflection ATR.
Figure 2 shows the region with the greatest spectral differences and many of these variations can be directly attributed to the published components. For example, the peak at 1400 cm-1 which appears in Visine represents C–O–H in-plane bending, characteristic of an acid functional group. Visine is the only formulation that contains boric acid, thus it is consistent with the presence of this band only for this substance. The same is true of the peak at 1150 cm-1 in the Visine spectrum, which denotes C–O bond carboxylic acid stretch. The Patanol spectrum shows only distinct peak, which occurs around 1075 cm-1, and it is likely to be the N–C stretching of its main component: olopatadine. The SunMark spectrum contains a C–O stretching peak at 1030 cm-1 characteristic of an alcohol, as expected from glycerin. It also exhibits a peak near 1110 cm-1 due to N–C stretching in its only active ingredient ketotifen.
Figure 2: Spectra of all samples in the 1500 cm-1 to 1000 cm-1 region. Patanol® (red), SunMark® (black), and Visine® (blue).
The ConcentratIR™, a multiple reflection diamond ATR accessory is effective in revealing spectral differences between complex solutions, even if those solutions are over 95% water. Its seven reflections in a 4 mm in diameter sampling area make it ideal for analyzing small quantities of liquids.
Harrick Scientific Products, Inc.
141 Tompkinss Ave., Box 277, Pleasantville, NY 10570
tel. (914) 747-7202, Fax: (914) 747-7209
Website:
almost 15 years ago
The Orbis Micro-XRF Analyzer Seriesalmost 15 years ago
Benchtop WDXRF for Cement Analysisalmost 15 years ago
Revisiting IR Transmission Sampling of Polymersalmost 15 years ago
Wire Grid Polarizer – 10% Improvement in PBS Efficiency