Article
Application Notebook
Application Notebook
The Orbis Micro-XRF Analyzer Series
Author(s):
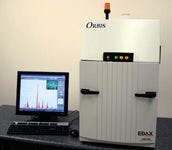
Building on more than 10 years of Micro-XRF experience, the Orbis spectrometer yields a system with excellent Micro-XRF capability while setting a new standard in analytical flexibility. The Orbis incorporates a unique motorized turret integrating video and X-ray optics allowing coaxial sample view and X-ray analysis. The turret can accommodate two additional collimators along with the X-ray optic for a total of three X-ray beam sizes to expand the Orbis analytical capabilities beyond traditional Micro-XRF analysis. Primary beam filters can be used with all spot sizes available on the turret to allow true XRF analytical capabilities in a micro-spot analysis. The working distance is increased to allow analysis over rougher sample topography without sacrificing signal intensity.
Building on more than 10 years of Micro-XRF experience, the Orbis spectrometer yields a system with excellent Micro-XRF capability while setting a new standard in analytical flexibility. The Orbis incorporates a unique motorized turret integrating video and X-ray optics allowing coaxial sample view and X-ray analysis. The turret can accommodate two additional collimators along with the X-ray optic for a total of three X-ray beam sizes to expand the Orbis analytical capabilities beyond traditional Micro-XRF analysis. Primary beam filters can be used with all spot sizes available on the turret to allow true XRF analytical capabilities in a micro-spot analysis. The working distance is increased to allow analysis over rougher sample topography without sacrificing signal intensity.
The Orbis is a table-top unit with powerful, easy-to-use analysis software. Orbis users can make elemental analyses on small samples such as particles, fragments and inclusions, or automated multipoint and elemental imaging analysis on larger samples with all the benefits and simplicity of an XRF analyzer. Benefits include:
- Nondestructive measurement
- Minimal sample preparation (for example, no sample coating is necessary)
- Improved sensitivity for many elements in comparison to SEM/EDS
- Inclusion and coating thickness analysis with the penetrating power of X-rays
- Analysis of wet samples
Small Spot Analysis
Small spot XRF analysis is typically used for analysis of fragments, targeted analysis on larger components, and high-resolution elemental imaging. The Orbis system can be equipped with a 30 µm ultra high intensity poly-capillary capable of providing fast, sensitive XRF analysis. Glass fragments are typically analyzed by micro-XRF for criminal and industrial forensic applications. With the Orbis poly-capillary and primary beam filter system, fast, non-destructive analysis can be done with improved sensitivity at a spot size of 30 to 60 µm (FWHM) depending on the elemental X-ray energy.


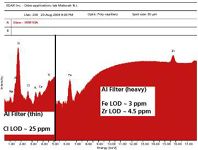
Figure 1: Orbis XRF spectrum (logarithmic intensity scale) of SRM 93A glass using two primary beam filters.
In Figure 1, analysis of glass using the 30 µm poly-capillary and primary beam filters for comparative purposes and compositional analysis is shown. Analysis of chlorine down to a limit of detection of approximately 25 ppm was achieved using a filter to remove the overlapping Rh (L) tube scatter line.

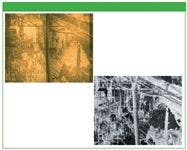
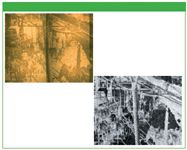
Figure 2: (Above) Orbis montage video composite of mapped area (27.5 mm à 16.5 mm) on a faded black/white photo. The image is of a horse-drawn wagon on a city street. (Below) Ag (L) elemental image of photo using 30 µm poly-capillary at approximately 250 DPI pixel density.
In another example (see Figure 2), the Orbis poly-capillary is used to elementally image a portion of a fading black and white photo using the Ag (L) signal to digitize the image. This was done as part of an initial effort to evaluate the suitability of micro-XRF imaging for the archival preservation of Ag-based photos.
Large Spot Analysis
In a variety of analytical scenarios, XRF analysis using a larger analytical beam diameter is more advantageous than probing the sample with a small beam analysis. Analyzing inhomogeneous materials, for example, with a small probe beam yields information on the level of inhomogeneity of the material while analyzing with a large, collimated beam can give a compositional analysis more consistent with the average composition with improved high energy line sensitivity. A larger analytical beam is also useful for measuring sample inhomogeneity over a larger area. A good example of this comes from the measurement of thickness and composition on a photovoltaic panel.
A thin layer of copper, indium, gallium, and selenium (CIGS) semiconductor material is commonly used in the production of thin film solar cells. In the following example, CIGS was sputter coated onto a large molybdenum-coated glass substrate. The molybdenum metal coating serves as an electrode and electrical contact. Hence, the coating structure analyzed was a CIGS coating over a molybdenum coating on the glass substrate. The main goal of the XRF analysis was to determine how large the edge effects are in such a sputter coating process for the CIGS layer.

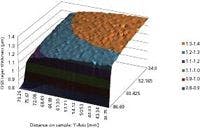
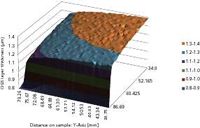
Figure 3: CIGS layer thickness measured over a 40 mm à 40 mm area near edge of effective sputtering region.
Measurements were made on a 40 mm × 40 mm section of the coated solar panel sampled from an edge of the panel located at the limits of the effective area of the sputter coating process. A 1 mm collimator was used with a contiguous matrix of analysis points to measure the homogeneity of the CIGS coating over the entire 1600 mm2 area. Orbis coating software was employed which has the capability to measure thickness and composition of up to 5 layers with up to 10 elements in alloy layers. The coating software calculations are based on a Fundamental Parameter algorithm which allows measurements to be made without standards in a full computer modeling mode and to accept the input of a minimal number of standards to provide the computer calculations with a calibration reference. In this example, one standard (CIGS layer: 2.15 µm; 18.9 At% Cu, 15.9% In, 4.9 At% Ga, 60.3 At% Se; Mo layer: 0.28 µm) was used to increase the accuracy of the thickness/composition calculations.


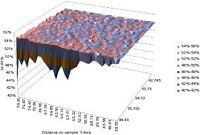
Figure 4: Selenium atomic % composition measured over a 40 mm à 40 mm area near edge of effective sputtering region.
The results of the coating analysis for the CIGS layer are shown in Figures 3 and 4. Figure 3 shows the film thickness of the CIGS layer. A gradient in film thickness is clearly observed extending approximately 2 cm from either edge of the panel. Figure 4 shows the concentration of the Se component of the CIGS layer. The overall average measured Se concentration around 54 At% is consistent with the reported effort to enrich the CIGS layer in Ga well beyond what is typical, approximately 4 to 5 At%. The composition of the CIGS layer is highly uniform up to within roughly 2 mm of the edge of the panel. This suggests that while the overall amount of material being sputter deposited on the edge of the panel is decreased, the overall composition of that material is unchanged.


Conclusion
The Orbis micro-XRF spectrometer was developed to provide a state-of-the-art micro-XRF analyzer with excellent analytical flexibility. Orbis systems provide the user with:
- Access to both ultra-high intensity X-ray optics and larger beam collimators
- Primary beam filters at all spot sizes, small and large
- Improved elemental sensitivity
- Multilayer coating thickness and composition analysis
With this analytical flexibility, the Orbis system is capable of providing solutions to a wide variety of problems suited to XRF analysis.
EDAX Inc.
91 McKee Drive, Mahwah, NJ 07430
tel. (201) 529-4880, Fax (201) 529-3156
Website: www.edax.com


Newsletter
Get essential updates on the latest spectroscopy technologies, regulatory standards, and best practices—subscribe today to Spectroscopy.


