Article
Application Notebook
Application Notebook
Automated Circular Dichroism: A Powerful Tool for the Optimization of Protein Formulation
The polyclonal IgG in this study is more thermally stable at neutral pH, (4.8 to 7.8) than it is at lower pH. The loss of thermal stability at lower pH is concomitant with a change in the pre-transition folded structure of the protein.
David Gregson and Lindsay Cole, Applied Photophysics Ltd
The polyclonal IgG in this study is more thermally stable at neutral pH, (4.8 to 7.8) than it is at lower pH. The loss of thermal stability at lower pH is concomitant with a change in the pre-transition folded structure of the protein. Once thermally unfolded, aggregation occurs at neutral pH, while aggregation does not occur at lower pH. Automation of the Dynamic Multimode Spectroscopy (DMS)technique using the Chirascan™-plus automated circular dichroism spectrometer (ACD) allowed a large number of buffer conditions to be studied quickly and easily.
- Greatest thermal stability occurs at pH > 5
- Greatest resistance to aggregation is seen at pH < 5
- Pre-transition conformation changes with pH
- Aggregation, when it occurs, is easily detected
- Quantitative results with errors are readily calculated
- Protein usage per denaturation is low ~60 μg
- Unattended operation – overnight measurement
Experimental Conditions
Samples were transferred from a 96-well plate to a 0.2 mm spectroscopic flow-cell via an injection port, using a fixed-probe x, y, z robot. Each sample was heated continuously at 1 °C per minute from 20 °C to 95 °C while measuring far-UV circular dichroism spectra from 250 nm to 200 nm in 1 nm steps with a sampling time of 0.8 s per point. Each spectrum took approximately 1 min to measure, giving a spectrum for every 1 °C rise in temperature and thus a total of 75 far-UV spectra per denaturation. The conditions screened were from pH 2.2 to pH 7.8 in 0.8 pH steps, controlling the pH by varying the relative concentrations of citrate and phosphate in a 75 mM phosphate-citrate/150 mM NaCl buffer.
Results
The denaturation data for this polyclonal IgG do not show the separate CH2, Fab, CH3 transitions that might be expected from a monoclonal IgG because of overlap of the contributions from the various components of the sample. A single transition model suffices to describe the data and global analysis yields a Tm for each of the eight denaturation datasets. The results show that thermal stability reduces significantly as the pH of the buffer dips below 5 as seen in Figure 1. Absorbance data are measured simultaneously with CD and are used to monitor aggregation. If there is an apparent increase in absorbance at wavelengths in the spectrum where there is little or no true absorbance, it can be ascribed to light scattering caused by the formation of insoluble aggregates. Absorbance is thus used as a proxy for light scattering and hence indicates the onset of aggregation. The partial loss of pre-transition secondary structure as the buffer becomes more acidic is seen clearly in the fitted spectra in Figure 2.

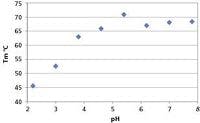
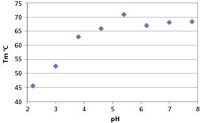
Figure 1: Effect of pH of the buffer on the Tm of IgG: note the >20 °C drop in Tm at low pH.
Conclusion
This simple citrate-phosphate buffer screen gives a wealth of information that indicates clearly the behavior that can be expected of this protein across a wide range of pH values. Thermal stability, aggregation tendency and the pre-transition conformation do not all indicate the same optimum buffer conditions if taken in isolation. Taken together, a better picture of the likely optimum buffer pH is gained.

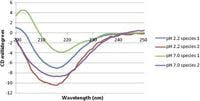
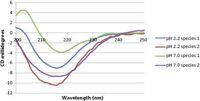
Figure 2: Fitted folded (species 1) and unfolded (species 2) at neutral and low pH. The spectra have been derived from the global model fit.
The automation of DMS experiments using Chirascan™-plus ACD dramatically reduces the work required to collect these data. The experiment described here took less than 30 min to set up and was run overnight without further user intervention. The total quantity of protein used in measuring all eight denaturation datasets was under 500 μg, a very modest usage for the information returned.
Applied Photophysics Ltd
21 Mole Business Park, Leatherhead, KT22 7BA
Surrey, United Kingdom
E-mail: sales@photophysics.com, website www.photophysics.com


Newsletter
Get essential updates on the latest spectroscopy technologies, regulatory standards, and best practices—subscribe today to Spectroscopy.


