
This article provides a convenient summary of portable and handheld spectroscopy techniques, outlining the most prominent types of compact instruments for both atomic and molecular spectroscopy.

Jerome Workman Jr. serves on the Editorial Advisory Board of Spectroscopy and is currently with Unity Scientific LLC. He is also an adjunct professor at Liberty University and U.S. National University. He can be reached at [email protected].
This article provides a convenient summary of portable and handheld spectroscopy techniques, outlining the most prominent types of compact instruments for both atomic and molecular spectroscopy.

Spectroscopy Magazine sat down with Kay Sowoidnich to talk about how his group has demonstrated the potential of shifted-excitation Raman difference spectroscopy (SERDS) as an efficient tool for soil nutrient analysis.
This issue is a compilation of peer-reviewed articles on the subjects of fluorescence and the optical properties of materials.
We explore how different algorithms and different numbers of factors affect the results.
Recent collaborative research demonstrates the use of Kerr-gated Raman spectroscopy to study catalysts and catalytic reactions for investigating renewable energy sources.
Markita Landry, the winner of the 2020 Emerging Leader in Molecular Spectroscopy Award, works at the intersection of single-molecule biophysics and nanomaterial-polymer science to develop new tools for understanding biological systems.
By combining single-molecule biophysics and nanomaterial-polymer science, Markita Landry of the University of California, Berkeley has developed new tools for understanding biological systems. Using a combination of nanoparticles, imaging, and spectroscopy, her work has led to discovery of the aspects of neuromodulation in the brain, and for the delivery of genetic materials into plants for crop biotechnology.

We provide a scorecard of chemometric techniques used in spectroscopy. The tables and lists of reference sources given here provide an indispensable resource for anyone seeking guidance on understanding chemometric methods or choosing the most suitable approach for a given analysis problem.
Spectroscopy
In celebration of Spectroscopy’s 35th Anniversary, leading experts discuss important issues and challenges in analytical spectroscopy.

In this interview, Dr. Claudia Conti, a senior researcher at the Institute of Heritage Science (ISPC) of the Italian National Research Council (CNR), talks about her work in micro-SORS. Conti is the winner of the 2020 Craver Award presented by the Coblentz Society, to be given at the 2020 SciX conference for her Raman research. The SciX conference is scheduled for October 11–16 in Sparks, Nevada. This interview is part of a series of interviews with winners of awards presented at SciX.

Working at the frontiers of biotechnology, fiberoptics, lasers technique and molecular spectroscopy, Tuan Vo-Dinh of Duke University has developed multiple sensor technologies useful for medical research and diagnostics. In this interview, he talks about his work in spectroscopy and photonics. Vo-Dinh is the winner of the 2019 Royal Society of Chemistry (UK) Sir George Stokes Award. He gave a plenary lecture at the 2020 SciX conference, in October in Sparks, Nevada. This interview is part of an ongoing series with the winners of awards that are presented at SciX.

Overall, the application of Raman spectroscopy has yielded greater understanding of multiple biomedical problems. We interviewed Prof. Yuki Ozaki, professor emeritus and a university fellow at Kwansei Gakuin University in Japan, about his work in this field. Ozaki is the winner of the 2020 Charles Mann Award for Applied Raman Spectroscopy to be given at the 2020 SciX conference for his Raman work in biomedical applications. This interview is part of a series of interviews with winners of awards presented at SciX.
The Raman Terminology Guide you now have before you is a comprehensive set of definitions for topics of interest to molecular spectroscopists and those specifically using Raman spectroscopy in their daily work. This guide includes the types of Raman spectroscopy techniques and many terms related to the applications of Raman spectroscopy instruments. This terminology guide includes definitions for more than 250+ molecular spectroscopy terms in sufficient detail to provide readers with a reasonable understanding of the concepts covered.

Spectroscopy
How can you detect the presence of an outlier when it is mixed with multiple other, similar, samples?
Spectroscopy
Outliers are fundamentally a very fuzzy notion. Here, we try to clear up what outliers are and how they affect your data.
Spectroscopy
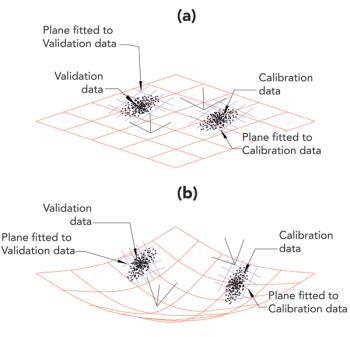
As we have previously discussed, the most time consuming and bothersome issue associated with calibration modeling and the routine use of multivariate models for quantitative analysis in spectroscopy are the constant intercept (bias) or slope adjustments. These adjustments must be routinely performed for every product and each constituent model. For transfer and maintenance of multivariate calibrations this procedure must be continuously implemented to maintain calibration prediction accuracy over time. Sample composition, reference values, within and between instrument drift, and operator differences may be the cause of variation over time. When calibration transfer is attempted using instruments of somewhat different vintage or design type the problem is amplified. In this discussion of the problem we continue to delve into the issues causing prediction error, bias and slope changes for quantitative calibrations using spectroscopy.
Spectroscopy
Part III of this series discusses the principle of least squares

Currently, there is significant interest in using vibrational spectroscopy techniques for a variety of biomedical applications, and the methods are showing good promise. Karen Faulds, a professor at the University of Strathclyde in Glasgow, has been investigating the application of surface-enhanced Raman spectroscopy (SERS) to the detection of disease pathogens, such as meningitis, and to distinguish related pathogens in a complex matrix. Faulds is the 2016 recipient of the Coblentz Society’s Craver Award, which recognizes the efforts of young professional spectroscopists who have made significant contributions in applied analytical vibrational spectroscopy. This interview is part of a series of interviews with the winners of awards that will be presented at the SciX 2016 conference.
Spectroscopy
This column addresses the issue of degrees of freedom (df) for regression models. The use of smaller degrees of freedom (df) (e.g., n or n-1) underestimates the size of the standard error; and possibly the larger df (e.g., n-k-1) overestimates the size of the standard deviation. It seems one should use the same df for both SEE and SECV, but what is a clear statistical explanation for selecting the appropriate df? It is a good time to raise this question once again and it seems there is some confusion among experts about the use of df for the various calibration and prediction situations - the standard error parameters should be comparable and are related to the total independent samples, data channels containing information (i.e., wavelengths or wavenumbers), and number of factors or terms in the regression. By convention everyone could just choose a definition but is there a more correct one that should be verified and discussed for each case? The problem with this subject is in computing the standard deviation using different df without a more rigorous explanation and then putting an over emphasis on the actual number derived for SEE and SECV, rather than on using properly computed confidence intervals. Note that confidence limit computations for standard error have been discussed previously and are routinely derived in standard statistical texts (4).

Spectroscopy
This column is the continuation of our discussion in part I dealing with statistics.
Spectroscopy
We present the first of a short set of columns dealing with the subject of statistics. This current series is organized as a “top down” view of the subject, as opposed to the usual literature (and our own previous) approach of giving “bottom up” description of the multitude of equations that are encountered. We hope this different approach will succeed in giving our readers a more coherent view of the subject, as well as persuading them to undertake further study of the field.
Spectroscopy
The archnemesis of calibration modeling and the routine use of multivariate models for quantitative analysis in spectroscopy is the confounded bias or slope adjustments that must be continually implemented to maintain calibration prediction accuracy over time. A perfectly developed calibration model that predicted well on day one suddenly has to be bias adjusted on a regular basis to pass a simple bias test when predicted values are compared to reference values at a later date. Why does this problem continue to plague researchers and users of chemometrics and spectroscopy?
Spectroscopy
When using any regression technique, either linear or nonlinear, there is a rational process that allows the researcher to select the best model.
Spectroscopy
What is it that we thought we knew that we have learned "ain't so" from the work reported in this series of columns?Volume 30 Number 2Pages 24-33What is it that we thought we knew that we have learned "ain't so" from the work reported in this series of columns?
Spectroscopy
How do current commercial instruments vary with respect to photometric accuracy and precision over time? What are potential solutions to this challenge?
Spectroscopy
Now that we have shown the relationships between different units for concentration, we continue by demonstrating their effects on the data we collected and used for our examples. What are the ramifications and consequences of these findings?
Spectroscopy
What are the techniques and mathematics used to compute uncertainty, and the optimum methods for maintaining wavelength accuracy within instrumentation over time, when considering measurement condition changes?
Spectroscopy
The data show that different units of measurement have different relationships to the spectral values, for reasons having nothing to do with the spectroscopy. This finding disproves the assumption that different measures of concentration are equivalent except, perhaps, for a constant scaling factor.
Spectroscopy
The statistical methods used for evaluating the agreement between two or more instruments (or methods) for reported analytical results are discussed, with an emphasis on acceptable analytical accuracy and confidence levels using two standard approaches, standard uncertainty or relative standard uncertainty, and Bland-Altman "limits of agreement."
Spectroscopy
Calibration transfer is a series of techniques used to apply a single spectral database, and the calibration model developed using that database, to two or more instruments. Here, we review the mathematical approaches and issues related to the calibration transfer process.