Columns | Column: Molecular Spectroscopy Workbench

Spectroscopy

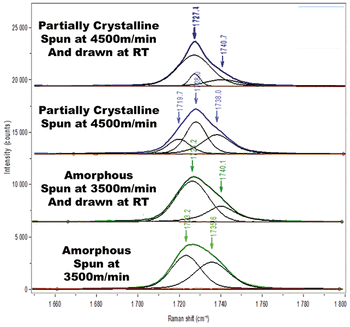
Because of the structural use of polymers, it is important to understand the origin of their strength, elongation to break, elasticity, flexibility, and so on. It is in the very low frequency region (the so called “terahertz” range) where it is believed that the real indicators for crystallinity appear.

Spectroscopy

Raman spectroscopy is a convenient method for probing the chemical bonding and solid state structure of crystals, and it is sensitive to the presence of dopants, impurities, and crystal defects in the host-crystal lattice. Here is what you need to know about how a hostcrystal Raman spectrum is affected by dopants and impurities.

Spectroscopy

The Raman spectra of a particular face of a single crystal can be significantly different if acquired with different microscope objectives. This article explains the underlying physics of changes in relative intensity and even peak position of certain Raman bands depending on the microscope objective used to acquire the spectrum.

Spectroscopy

The Raman spectra of crystalline and amorphous solids of the same chemical composition can be significantly different primarily because of the presence or absence of spatial order and long range translational symmetry, respectively. The purpose or goal of this installment of Molecular Spectroscopy Workbench is to help readers understand the underlying physics that affect the Raman spectra of crystalline and amorphous solids. Wave vector, reciprocal space, and the Brillouin zone are explained with respect to Raman spectroscopy of solids.

Spectroscopy

Controlling the orientation of the laser and Raman polarization relative to the sample orientation can provide a wealth of information in the Raman spectrum that would be difficult to achieve by other methods. Presentation of the spectra makes these effects appear straightforward, but because of multiple instrumental factors, and experimental design, it is easy to produce erroneous results. This column is going to explain what instrumental components affect the polarization effects that are observed, and how the sample setup itself affects the Raman signal.

Spectroscopy

Raman spectroscopy can be used to determine the temperature of a material when other more direct means are either impractical or not possible. The material’s temperature can affect the peak position of Raman bands. When a Raman band shifts significantly with temperature, the monitoring of the peak position can be the most straightforward manner of determining temperature provided the Raman spectrometer has sufficient spectral resolution. Another method is to determine the temperature from the ratio of the Stokes and anti-Stokes signal strengths of a given Raman band. The latter method requires the ability to detect light at wavelengths longer and shorter than that of the laser and an accurate measurement of the wavelength dependent instrument response function.

Spectroscopy

Raman spectra of celluloses modified for use in the pharmaceutical, food, and materials industries will be compared and analyzed, with the goal of determining spectroscopic features that can be of use in aiding in the determination of physical and chemical properties.

Spectroscopy

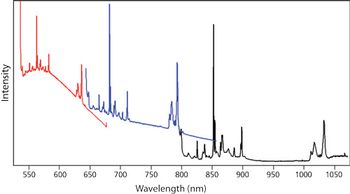
Photoluminescence can provide information about the composition and solid state structure of a material. The high spectral resolution of a Raman spectrometer can be useful in performing photoluminescence spectroscopy of solid state materials, particularly when the emission spectra consist of narrow bands or even lines. Having the capability to perform photoluminescence and Raman spectroscopies simultaneously with the same instrument is advantageous, especially when studying 2D crystals. When used to perform photoluminescence spectroscopy, the Raman spectrometer becomes two instruments in one.

Spectroscopy

In the “Molecular Spectroscopy Workshop” column, we have been trying to provide hands-on advice and easy-to-implement tips to start using spectroscopic tools for the analyst who has the responsibility to derive answers to questions as quickly as possible. Very often the identity of an unknown is of ultimate importance, and very few analytical chemists coming out of graduate programs have been taught to systematically analyze spectra to infer identity of the source. In addition, it is rare that an industrial environment will provide resources for the analyst to be educated in this field. Thus, the availability of any means to provide spectral identification will make the difference between success and failure; that is, acquiring a spectrum is useless if one cannot identify it. In this column, I discuss some of the fundamentals of spectral interpretation, illustrate the use of searching software, including mixture analysis, and show how sometimes the software can provide spectral interpretation.

MSW-figure02_web.jpg

Spectroscopy

Were it not for the problem of photoluminescence, only one laser excitation wavelength would be necessary to perform Raman spectroscopy. Here, we examine the problem of photoluminescence from the material being analyzed and the substrate on which it is supported. Selecting an excitation wavelength that does not generate photoluminescence reduces the noise level and yields a Raman spectrum with a superior signal-to-noise ratio. Furthermore, we discuss the phenomenon of resonance Raman spectroscopy and the effect that laser excitation wavelength has on the Raman spectrum.

Spectroscopy

The use of Raman spectroscopy to produce material images whose contrast is derived from chemical or crystallographic species has been seen as quite useful since the introduction of the Raman microscope in 1976, but particularly, more recently, with the development of more sensitive and easier-to-use instruments. When the various species in the field of view have spectra with non-overlapping analytical bands, simple univariate analysis can provide good images. When overlapping bands are present, multivariate techniques, especially MCR (Multivariate Curve Resolution), have been successfully applied. However, there are cases where even MCR results may be problematic. We will look at some maps of a ceramic composite containing SiC, Si, B4C, and Carbon, where each of these species has non-unique spectra to see what type of results flexible software can produce. What is the goal in this type of exercise? For some of us, creating images is like a teenager’s computer game. But really what we are trying to do is to extract information about a sample from its Raman image. A beautiful rendition is nice, but it must yield information. The following will show how Raman maps can provide useful information on a sample.

Spectroscopy

The application of vibrational selection rules is usually taught with respect to the vibrational motions of individual molecules. However, many of the materials studied by infrared or Raman spectroscopy are solids and even single crystals. Furthermore, some materials such as covalent or ionic solids have no molecular species associated with them. Consequently, there is a need to understand the application of group theory for the determination of spectroscopically active vibrational modes of crystals. The correlation method is ideal for that purpose.

Spectroscopy

This column is a mini survey of progress that has been made over the last few years in surface enhanced Raman scattering (SERS). The potential of SERS to provide signals of analytes at very low concentrations continues to beckon the analytical chemist. What the last years have produced is a body of work showing the role of the physical properties of metals, based on their geometrical and electronic properties, in enhancing the signals. As this field matures, we foresee production of surface enhancing films and particles that will provide reproducible Raman signals for applications in areas such as environmental and biomedical studies.

Spectroscopy

Raman bands in the low energy region of the spectrum of crystals are attributed to so-called external lattice vibrational modes. The Raman bands from these external vibrational modes (low energy phonons) are very sensitive to crystal structure and orientation with respect to the incident laser polarization and to molecular interactions within the crystal. The low energy vibrational modes of many organic molecular crystals have very high Raman scattering cross-sections. Raman spectra and images of low energy phonons in so-called two dimensional (2D) crystals such as few-layer MoS2 reveal spatial variations in the solid state structure that are not evident in the higher energy bands.

Spectroscopy

There is growing interest in using Raman as a spectroscopic probe of biological systems based on its high information content, its compatibility with an aqueous environment, and the spatial resolution that is consistent with physical optics (as good as ~0.5 μm).

Spectroscopy1_i4.jpg

Spectroscopy

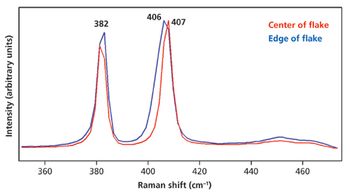
 Resonance and off-resonance Raman spectroscopy and imaging are used to examine the spatial variation of the solid-state structure and electronic character of few-layer MoS2 flakes. Simultaneous acquisition of photoluminescence spectra with the Raman scattering provides complementary ways of rendering Raman and photoluminescence spectral images of thin-film MoS2.

Spectroscopy

There are multiple circumstances where characterization of a collection of particles has value to analysts. In some environments, materials are plagued by particulate contamination that impacts product quality.

Spectroscopy

Segmented channel waveguides have been fabricated in single-crystal KTiOPO4 through a topotactic process of partial cation exchange. The ion-exchanged waveguides maintain the high nonlinear susceptibility of KTiOPO4 to function as frequency doubling laser light sources

Special Issues

Segmented channel waveguides have been fabricated in single-crystal KTiOPO4 through a topotactic process of partial cation exchange. The ion-exchanged waveguides maintain the high nonlinear susceptibility of KTiOPO4 to function as frequency doubling laser light sources

Spectroscopy

Metal oxides often occur in crystals where there are no molecular units. Here, we provide an introduction to the concepts that need to be understood when analyzing metal oxides in materials such as paint, ceramic pigments, corrosion films, catalysts, and minerals.

Spectroscopy

We examine vapor-phase Raman spectroscopy through the acquisition of spectra from gas molecules confined to the headspace.

Spectroscopy

What exactly is a "Raman image" and how is it rendered? The authors explain those points, and demonstrate the use of Raman imaging for the characterization of thin-film and ion-implanted silicon structures. High spectral resolution makes it possible to resolve or contrast the substrate silicon and polysilicon film in Raman images and thus aids in the chemical or physical differentiation of spectrally similar materials.