Data Analytics, Statistics, Chemometrics, and Artificial Intelligence
Latest News
Latest Videos

Shorts
More News

A recent study demonstrated that combining laser-induced breakdown spectroscopy (LIBS) with machine learning (ML) can accurately identify gunshot residue from nontoxic ammunition and reliably distinguish shooters from non-shooters despite the absence of traditional elemental markers.

Over the past three to four years, Fourier Transform Infrared (FT-IR) spectroscopy has emerged as one of the most rapidly expanding vibrational techniques in biomedical research. Driven by advances in attenuated total reflectance (ATR), live-cell measurements, chemometrics, and machine learning (ML), FT-IR has moved beyond descriptive biochemical profiling toward predictive diagnostics and translational clinical science. This article highlights and critically summarizes the top 10 most influential peer-reviewed articles published recently on FT-IR applications in tissues, cells, hair, blood, saliva, urine, and exercise physiology, emphasizing analytical innovation, clinical relevance, and future impact.

In the past few years, Raman spectroscopy and its technological modifications—such as surface-enhanced Raman spectroscopy (SERS), coherent Raman scattering (CRS), and multimodal platforms—have transitioned from proof-of-concept demonstrations to impactful tools in biomedical research. These advances span therapeutic monitoring, chemical biology imaging, deep-tissue diagnostics, precision oncology, and multimodal analytics. This article synthesizes the most influential reviews in these areas, highlighting emerging trends, limitations, and future directions.

For Pittcon 2026, the James L. Waters Symposium, scheduled for Monday, March 9, from 2:30 to 4:40 p.m. in Room 221A, turns its focus on Generative artificial intelligence (AI) systems in analytical chemistry, which are increasingly being used for analytical data interpretation, algorithm development, experimental planning, and scientific communication. This article introduces the general concepts of generative AI and its use in spectroscopy.

The 2026 James L. Waters Annual Symposium at Pittcon will focus on the integration of generative AI into analytical chemistry, examining how large language models and AI tools can support method development, data analysis, and chemical measurement while maintaining scientific rigor, validation, and interpretability. Continuing its decades-long tradition of connecting historical perspective with emerging technologies, the symposium will feature presentations from leading chemists and spectroscopists, highlighting both the opportunities and challenges of responsibly incorporating AI into chemical measurement science.

In this article, we illustrate how automated calibration systems and sophisticated algorithms are transforming chemical data into actionable knowledge.

Researchers at the University of Minnesota have developed a dual AI framework that uses synthetic vegetation index data and an advanced Transformer-based segmentation model to significantly improve early detection of winter damage on golf course turf.

Researchers at Washington State University Tri-Cities demonstrate that combining Raman and infrared spectroscopy with convolutional neural networks enables highly accurate, low-cost, and field-ready automated plastic identification.

Artificial intelligence is transforming vibrational spectroscopy by automating calibration, feature extraction, and interpretation across Raman, infrared, near-infrared (NIR), and hyperspectral imaging (HSI) systems. This review of articles highlighted in Spectroscopy during 2025 captures several major developments, spanning data fusion, spectral imaging, and industrial and biomedical applications.

In this Spectroscopy blog post, Yang Liu, a Scientific Liaison for General Chapters at the United States Pharmacopeia (USP), discusses how data-driven methodologies are set to transform spectroscopy in 2026 and beyond, particularly in pharmaceutical analysis.

In 2025, the vibrational-spectroscopy community saw a convergence of deep learning, advanced simulation, and portable instrumentation that materially changed how spectra are interpreted and applied.

A proposed update to United States Pharmacopoeia (USP) <1029> was published in July 2025 for industry comment. What’s changed and are the changes significant?

Top articles published this week include interviews with Paolo Oliveri of the University of Genoa (Italy) and Maryam Shakiba and Santiago Marin of the University of Colorado Boulder, and an inside look at vibrational spectroscopy trends.

A new study from Heilongjiang Bayi Agricultural University introduces a high-accuracy, explainable deep learning model that significantly improves nondestructive nitrogen and chlorophyll estimation in maize canopies using hyperspectral data.

In this short feature, we highlight how the Sharjah Academy of Astronomy, Space Sciences, and Technology (SAASST) are using techniques such as XRF, XRD, SEM-EDS, and Raman tests to determine the mineral composition of meteorites.

This review article highlights how a new review by Da-Wen Sun demonstrates that integrating spectroscopy with chemometric techniques can significantly improve cold chain food quality monitoring, authentication, and overall system efficiency.

A new review by researchers from the University of Waterloo, Sanofi, and McGill University highlights how vibrational and fluorescence spectroscopy are reshaping real-time monitoring of pharmaceutical bioprocesses. The authors detail recent advances in UV-Vis, NIR-MIR, Raman, and fluorescence sensing, supported by modern chemometrics and AI tools.

A recent study demonstrates that near-infrared (NIR) spectroscopy is a fast, cost-effective, and reliable tool for assessing soil and tree ecological traits, offering major potential for large-scale forest conservation and monitoring.

A new perspective article by Anna de Juan and Rodrigo Rocha de Oliveira highlights how hyperspectral imaging (HSI), paired with advanced chemometrics, is redefining process analytical technology (PAT) by coupling chemical specificity with full-field spatial resolution. Their work outlines how HSI surpasses classical spectroscopic PAT tools and enables quantitative, qualitative, and mechanistic insight into chemical processes in real time.

A recent study demonstrated that deep learning combined with ICP spectroscopy can accurately and affordably predict multiple soil properties.

The article highlights how rapidly advancing, non-destructive spectroscopic and imaging technologies, supported by AI, multi-modal data integration, and increasing instrument portability.

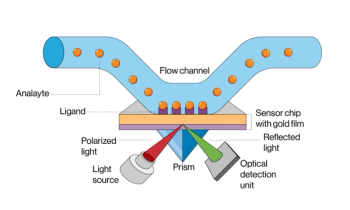
A research team has developed the first short synthetic peptide-based biosensor for real-time tracking of the disease-related protease matrix metalloproteinase-9 (MMP-9), using multi-parametric surface plasmon resonance spectroscopy (MP-SPR).

This tutorial introduces spectroscopy professionals to the operational principles, practical workflows, and laboratory applications of biosensors. It covers core definitions, biosensor types, transduction methods, nanomaterials-enabled strategies, and optical/electrochemical approaches relevant to spectroscopic analysis. Readers will learn how biosensors integrate biological recognition with physicochemical detection, how to implement them in real-world measurement tasks, and how to avoid common technical pitfalls when translating biosensor theory into laboratory practice.

A new study published in Ecological Informatics finds that hyperspectral remote sensing combined with machine learning can accurately predict grassland forage quality across global biomes.

Karl Booksh, a Professor of Chemistry at the University of Delaware, has won the 2025 EAS Award for Outstanding Achievements in Chemometrics.


