


Data Analytics, Statistics, Chemometrics, and Artificial Intelligence
Latest News

Advertisement
Latest Videos


Shorts

Advertisement
More News

Researchers at the National University of Singapore have demonstrated that widely used spectroscopic methods for detecting adulteration in edible bird's nest products are based on a false assumption — that genuine product has a uniform chemical signature.

Spectroscopy is telling us the extraterrestrial history of space objects, helping us learn about planetary origins.

In this brief Q&A interview, Christina Ryder, who is a postdoctoral researcher at Texas A&M University and the lead author of this study, discusses her team’s findings.

The following articles are the 10 most accessed digital object identifier (DOI) manuscripts for Spectroscopy and LCGC International during March, 2026.
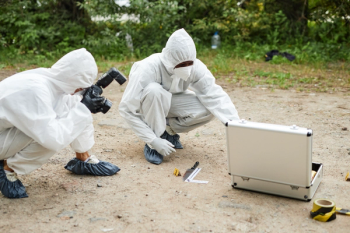
Over the past two years, molecular spectroscopy has undergone a marked transformation from a predominantly laboratory-based analytical approach into a field-deployable, data-rich forensic toolkit. This evolution has been driven by three converging trends: (i) advances in vibrational spectroscopic instrumentation (Fourier transform infrared [FT-IR], Raman, and near-infrared [NIR], (ii) the integration of chemometrics and machine learning for extracting actionable information from complex spectra, and (iii) the emergence of portable and miniaturized devices suitable for in situ analysis. The ten papers reviewed here collectively demonstrate how spectroscopy is now addressing some of the most persistent challenges in forensic science—such as time since deposition (TSD), post-mortem interval (PMI), trace evidence discrimination, and rapid drug identification—while maintaining evidentiary integrity through non-destructive analysis. Importantly, these works also reflect a shift toward interpretability, validation, and legal defensibility, which are essential for courtroom acceptance.

This article is derived from an invited talk given at the Pittcon Conference and Expo in San Antonio, Texas on Monday, March 9, exploring how generative artificial intelligence may transform the daily practice of analytical chemistry. It was presented in The James L. Waters Symposium.
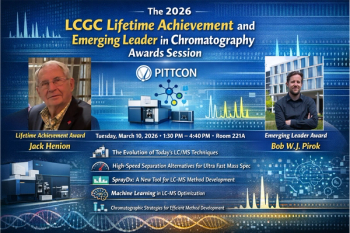
At Pittcon 2026 in San Antonio, Texas, the LCGC International Awards Session was held on Tuesday, March 10, from 1:30 PM to 4:40 PM. This session, presided by Jerome Workman, Jr., celebrated two distinguished scientists whose work has significantly influenced modern separation science. This annual session honors both a lifetime of achievement and the promise of emerging leadership in chromatography. In its nineteenth year, the program recognized Jack Henion with the LCGC Lifetime Achievement Award and Bob W. J. Pirok with the LCGC Emerging Leader in Chromatography Award.

The Pittcon (Pittsburgh) Conference and Expo in San Antonio featured a forward-looking symposium exploring how generative artificial intelligence (AI) may transform the daily practice of analytical chemistry. The James L. Waters Symposium, “Generative AI in the Analytical Chemist’s Toolbox for Chemical Measurements”, took place on Monday, March 9, 2026 (2:30–4:40 p.m.) in Room 221A. The session was presided over by Daniel W. Armstrong of The University of Texas at Arlington, who introduced the topic by emphasizing the rapidly expanding knowledge base required of modern analytical chemists. In addition to chemistry, today’s analytical scientist must command elements of physics, advanced mathematics, data science, and, increasingly, AI. The symposium focused on the practical integration of generative AI tools into chemical measurement science. Speakers discussed how AI can assist analytical chemists with tasks such as algorithm generation, signal processing, literature synthesis, and data interpretation. Importantly, the session emphasized responsible implementation, highlighting the need for rigorous validation, high-quality data sets, and integration into existing laboratory workflows.

At the Pittcon Conference and Expo in Saan Antonio, Texas, on Monday, March 9, 2026 (8:30–11:00 AM, Room 304C), the session “Spectroscopy and Sustainability: A Perfect Match” explored how modern spectroscopic technologies are helping laboratories and industries operate more efficiently while reducing environmental impact. Chaired by John Wasylyk and sponsored by the Society for Applied Spectroscopy, the session brought together 6 presentations covering applications from pharmaceutical process monitoring and biomedical diagnostics to chemical manufacturing, defense, and remote sensing. Throughout the morning, a consistent theme emerged: spectroscopy’s speed, nondestructive nature, and rich chemical information make it inherently aligned with the goals of sustainability.

The Top 10 Most Influential Applications of Vibrational Spectroscopy in Environmental Analysis (2024-2026)
Published: | Updated:
Between 2024 and 2026, environmental applications of vibrational spectroscopy advanced rapidly through innovations in multimodal instrumentation (combining 2 or more distinct measurement techniques), spectral data fusion, portable sensing technologies, and the integration of chemometrics and machine learning (ML). Near-infrared (NIR), Fourier transform infrared (FTIR), and Raman spectroscopy were increasingly deployed to address pressing environmental challenges such as microplastics contamination, soil organic matter quantification, indoor air quality monitoring, and pesticide residue detection in food and ecological systems. This article reviews 10 influential peer-reviewed papers published during this period, providing expanded narrative discussions of their technical contributions and explaining why each paper represents a significant impact on the field.

Researchers at Jiangsu University of Science and Technology showed that FT-IR spectroscopy combined with optimized chemometric modeling can rapidly and accurately detect and stage Bombyx mori nucleopolyhedrovirus infection in silkworms.

Artificial intelligence and machine learning are rapidly reshaping how analytical data are modeled, interpreted, and deployed, but the conceptual foundation is already familiar to practitioners of chemometrics. Latent variables, calibration models, variance–bias tradeoffs, and multivariate optimization did not originate with neural networks; they have been central to spectroscopic data analysis for decades. This expanded glossary provides a rigorous, side-by-side translation between modern artificial intelligence (AI) terminology and established chemometric concepts. This glossary is intended to demystify AI terminology, while preserving statistical clarity. It is designed to help analytical scientists, spectroscopists, and chemometricians engage with modern data-driven methods without abandoning physical interpretability or statistical discipline.

Spectroscopy is seeing several important changes in the industry. In this feature, we focus on four topics that have emerged.

A recent study demonstrates that updated predictive models based on NIR spectra can outperform traditional nitrogen-based prescreening methods in identifying samples suitable for radiocarbon dating.

From a chemometric standpoint, artificial intelligence (AI) in spectroscopy is best understood as an extension of established multivariate methods rather than as a replacement. Most AI approaches closely parallel familiar tools such as regression, classification, and principal component analysis, but offer greater flexibility to handle nonlinear behavior, interacting physical and chemical effects, and large, heterogeneous datasets. By learning directly from raw spectra, AI methods can reduce reliance on manual preprocessing while still indicating which spectral regions influence predictions. In this sense, AI represents a developmental layer of chemometrics that enables classical concepts to operate effectively in modern spectroscopic systems. Overall, AI is best viewed as the next developmental layer of chemometrics, not as a competing discipline. As with all current AI programs, domain knowledge of analytical chemistry is essential for AI’s effective application. Knowing the boundaries of what is plausible in any chemical or modeling system allows fine-tuning of the models towards useful and reliable analytical results.
At Pittcon, generative artificial intelligence will be presented at the James L Waters Symposium on Monday, March 9, 2:30 PM to 4:40 PM in Room 221A. Generative artificial intelligence has transitioned from a conceptual novelty to a practical approach for innovation in spectroscopic data analysis. During 2025, a small set of highly influential publications crystallized this transformation by demonstrating how generative models can synthesize realistic spectra, solve inverse spectral problems, accelerate materials discovery, and automate molecular structural elucidation. This article reviews six pivotal contributions published in 2025 that collectively define the state of generative artificial intelligence in spectroscopy. These works establish theoretical foundations, survey emerging methods, introduce physics-informed generative architectures, and demonstrate transformative applications across vibrational, electronic, and magnetic resonance spectroscopies.
Spectroscopists are routinely embracing complex algorithms to handle high-dimensional, nonlinear, and multimodal data. Why is this happening? We explore this question in this tutorial.
During 2025, near-infrared (NIR) spectroscopy has accelerated its transition from a mature analytical technique into a digitally enabled cornerstone of biopharmaceutical manufacturing and quality control. Advances in miniaturized instrumentation, process analytical technology (PAT), chemometrics, artificial intelligence (AI), and real-time process control technologies have driven NIR spectroscopy into new roles spanning upstream fermentation, downstream processing, raw material characterization, and continuous manufacturing. This article reviews and contextualizes ten influential peer-reviewed publications from 2025 that collectively define the current state and near-term trajectory of NIR spectroscopy in biopharmaceutical analysis.

Fourier transform infrared (FT-IR) spectroscopy has undergone a notable evolution in biopharmaceutical analysis over the past three years. Advances in crystal engineering, process analytical technology (PAT), chemometrics, machine learning (ML), and hyphenated analytical platforms have significantly expanded FT-IR’s analytical scope. This article reviews ten of the most influential publications from 2023–2026 that exemplify FT-IR’s growing role across the biopharmaceutical lifecycle, from drug substance design and formulation to manufacturing, quality control, and clinical bioanalysis.

Between 2023 and 2026, Raman spectroscopy transitioned from a supportive analytical technique to a central enabling technology in biopharmaceutical analysis and manufacturing. Advances in artificial intelligence (AI), machine learning (ML), automation, and surface-enhanced Raman spectroscopy (SERS) have expanded Raman’s role from nutrient monitoring to real-time prediction of critical quality attributes (CQAs), inline control of complex bioprocesses, and non-destructive analysis of finished drug products. This article reviews ten of the most influential publications from this period, highlighting how they collectively reshaped expectations for Raman spectroscopy as a process analytical technology (PAT) and a quality-by-design (QbD) tool in modern biopharmaceutical development.

A study from the İzmir Institute of Technology published in Food Chemistry shows that combining FT-IR spectroscopy with chemometric modeling enables rapid, non-invasive screening of iron supplements and protein–iron complexes for their ability to restore cellular iron status in iron deficiency anemia models.

A new review article explores how integrating artificial intelligence (AI) with established analytical techniques such as spectroscopy, chromatography, mass spectrometry (MS), and sensors is significantly improving the efficiency, accuracy, and scope of food chemistry research and food quality assessment.

Over the past two years, near infrared spectroscopy (NIRS) and related NIR techniques have seen rapid adoption in biomedical research. These developments span non invasive diagnostics, functional monitoring, machine learning integration, point of care probes, and applications in complex clinical settings such as liver fibrosis, viral detection, neonatal care, brain injury, and neurodegenerative disorders. This article synthesizes 10 key publications, highlighting trends, methodologies, and clinical potential.

A recent study demonstrated that combining laser-induced breakdown spectroscopy (LIBS) with machine learning (ML) can accurately identify gunshot residue from nontoxic ammunition and reliably distinguish shooters from non-shooters despite the absence of traditional elemental markers.
Over the past three to four years, Fourier Transform Infrared (FT-IR) spectroscopy has emerged as one of the most rapidly expanding vibrational techniques in biomedical research. Driven by advances in attenuated total reflectance (ATR), live-cell measurements, chemometrics, and machine learning (ML), FT-IR has moved beyond descriptive biochemical profiling toward predictive diagnostics and translational clinical science. This article highlights and critically summarizes the top 10 most influential peer-reviewed articles published recently on FT-IR applications in tissues, cells, hair, blood, saliva, urine, and exercise physiology, emphasizing analytical innovation, clinical relevance, and future impact.
Advertisement
Advertisement
Trending on Spectroscopy Online
1
The Recent Discoveries of the Atacama Large Millimeter/Submillimeter Array and the James Webb Space Telescope
2
Why Spectroscopists Should Attend the ACS Fall 2026 Conference
3
Spectroscopy Around the Globe, Episode 1: The Giza Pyramids
4
Evaluating Surface-Enhanced Raman Spectroscopy as a Potential Blood-Based Tool for Crohn’s Disease Detection
5