




This explainer video highlights how nuclear magnetic resonance (NMR) spectroscopy is being used to improve the evaluation of vegetable oil quality.
This explainer video highlights how nuclear magnetic resonance (NMR) spectroscopy is being used to improve the evaluation of vegetable oil quality.
This tutorial provides an in-depth discussion of methods to make machine learning (ML) models interpretable in the context of spectroscopic data analysis. As atomic and molecular spectroscopy increasingly incorporates advanced ML techniques, the black-box nature of these models can limit their utility in scientific research and practical applications. We present explainable artificial intelligence (XAI) approaches such as SHAP, LIME, and saliency maps, demonstrating how they can help identify chemically meaningful spectral features. This tutorial also explores the trade-off between model complexity and interpretability.

Researchers have demonstrated a non-invasive method using milk and near-infrared spectroscopy combined with Aquaphotomics to accurately detect Paratuberculosis in dairy cattle. The technique offers faster, more sensitive diagnosis than traditional methods.

Researchers have demonstrated that visible and near-infrared spectroscopy, combined with chemometric and aquaphotomic analysis, can accurately classify and quantify aflatoxin contamination in white and yellow maize, offering a faster, non-destructive alternative to traditional methods.
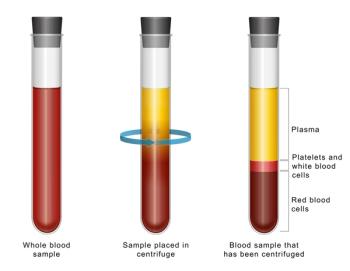
Researchers have developed a rapid, non-invasive screening method for esophageal squamous cell carcinoma (ESCC) using near-infrared spectroscopy and aquaphotomics. The approach analyzes plasma water patterns, achieving over 95% accuracy in distinguishing patients from healthy controls

A new study demonstrates how a machine learning technique, quantile regression forest, can provide both accurate predictions and sample-specific uncertainty estimates from infrared spectroscopic data. The work was applied to soil and agricultural samples, highlighting its value for chemometric modeling.

The Icons of Spectroscopy series shines a spotlight on the pioneers whose work laid the foundation for modern analytical science.
This tutorial contrasts classical analytical error propagation with modern Bayesian and resampling approaches, including bootstrapping and jackknifing. Uncertainty estimation in multivariate calibration remains an unsolved problem in spectroscopy, as traditional, Bayesian, and resampling approaches yield differing error bars for chemometric models like PLS and PCR, highlighting the need for deeper theoretical and practical solutions.

Researchers from Brazil have developed an improved method combining infrared and Raman spectroscopic techniques to better identify and characterize microplastics. This integrated approach enhances accuracy in distinguishing various polymer types and provides refined spectral analysis crucial for environmental studies.

This explainer video highlights how spectroscopy is being integrated with artificial intelligence to improve detection accuracy of microplastics.

A recent study demonstrated that UV–visible (UV-vis) spectroscopy combined with machine learning (ML) can provide a fast, cost-effective, and automated method for detecting biological contamination in microalgae cultures.

Raman spectroscopy, combined with computational modeling and machine learning, shows strong potential for distinguishing PFAS compounds, offering a promising new framework for environmental monitoring and contamination analysis.

A new study investigates how colorants embedded in microplastics (MPs) interfere with Raman spectroscopy, one of the key tools used to identify microplastic particles. The research details how fluorescence from these additives complicates spectral analysis, underscoring challenges in environmental microplastic detection.

A new review article highlights how Explainable Artificial Intelligence (XAI) can enhance transparency, trust, and innovation in agricultural spectroscopy, paving the way for smarter and more sustainable food quality assessment.

Researchers have developed a novel approach to quantify microplastics in water environments by combining Raman spectroscopy with convolutional neural networks (CNN). This integrated method enhances the accuracy and speed of microplastic identification, offering a promising tool for environmental monitoring.
This tutorial investigates the persistent issue of sample heterogeneity—chemical and physical—during spectroscopic analysis. Focus will be placed on understanding how spatial variation, surface texture, and particle interactions influence spectral features. Imaging spectroscopy, localized sampling strategies, and adaptive averaging algorithms will be reviewed as tools to manage this problem, as one of the remaining unsolved problems in spectroscopy.

This tutorial guides spectroscopy practitioners through the integration of Raman spectroscopy and machine learning (ML) techniques for detecting microplastics (MPs) in aquatic and environmental samples.

A recent study presented an AI-enhanced NIRS-XRF fusion spectroscopy method that significantly improves coal classification and quality prediction for coking enterprises.

A new review in Digital Discovery by Yongqiang Cheng of MIT and Oak Ridge National Laboratory highlights how AI-driven methods are changing how we study atomic vibrations.

ATR FT-IR shows polyethylene and polypropylene particles were common in facial scrubs and creams.

Researchers from Zhejiang University highlight how combining machine learning with spectroscopic imaging can transform biomedical research by enabling more precise, interpretable, and efficient analysis of complex molecular data.

The findings suggest that bottling processes and PET containers are major contributors to beverage contamination, raising concerns about food safety and environmental pollution.

A new study using infrared spectroscopy reveals that commercial beet sugar contains microplastic particles, raising concerns over food processing and packaging practices. Scientists identified various plastic types in sugar samples, including polyethylene and PET.
Inter-instrument variability is a major obstacle in multivariate spectroscopic analysis, affecting the reliability and portability of calibration models. This tutorial addresses the theoretical and practical challenges of model transfer across instruments. It covers spectral variability sources—such as wavelength shifts, resolution differences, and line shape variations—and presents key standardization techniques including direct standardization (DS), piecewise direct standardization (PDS), and external parameter orthogonalization (EPO). We discuss the underlying mathematics of these approaches using matrix notation and highlight limitations that must be considered for reliable universal calibration.
