


A recent study examined two chemometric methods for generating prediction rules.
A recent study examined two chemometric methods for generating prediction rules.

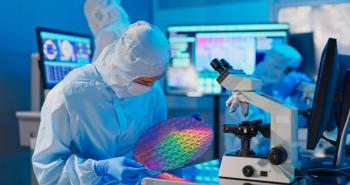
Henan University scientists recently developed a new deep learning-based prediction model for classifying nonclassical secreted proteins.
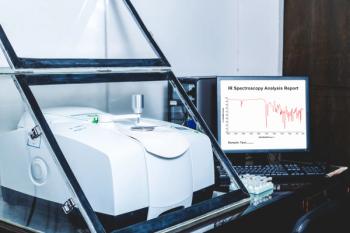
Scientists at Saint Petersburg Electrotechnical University introduced a new method for leveraging Fourier Transform Infrared Reflection Anisotropy Spectroscopy for the analysis of semiconductors.

Researchers at the Leibniz Institute of Photonic Technology have developed a rapid method to correct infrared attenuated total reflection (ATR) infrared spectra, essential for accurate analysis in various scientific fields. By bypassing iterative processes, this approach enhances efficiency and precision.

Researchers from Tsinghua University and Beihang University in Beijing have developed a deep-learning-based data processing framework that significantly improves the accuracy of dual-comb absorption spectroscopy (DCAS) in gas quantification analysis. By using a U-net model for etalon removal and a modified U-net combined with traditional methods for baseline extraction, their framework achieves high-fidelity absorbance spectra, even in challenging conditions with complex baselines and etalon effects.

A Researcher from Lomonosov Moscow State University has developed a convolutional neural network (CNN) model for Fourier transform infrared (FT-IR) spectra recognition. This AI-based system is capable of classifying 17 functional groups and 72 coupling oscillations with remarkable accuracy, providing a significant boost to material analysis in fields like organic chemistry, materials science, and biology.

Two researchers hailing from Wageningen University and the Norwegian University of Life Sciences collaborated on a new method that improves on existing multilinear predictive modeling methods.

Here are the top five articles that the editors of Spectroscopy published this week.

Scientists are using Raman spectroscopy and AI technology to streamline the pathological classification process.

A recent study offers an inside look as to how chemometric modeling is directly impacting greener analytical solutions.
Experts from BASF, the French National Institute for Agriculture, Food, and Environment, and other institutions discussed how their teams are using chemometrics to improve their work.

In a recent journal article, scientists wrote about on the impact machine learning algorithms have in measuring water quality, and how this technology can be evolved further.

Here are the top five articles that the editors of Spectroscopy published this week.
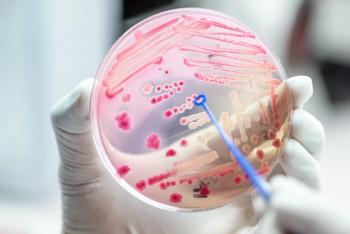
Scientists from Ben-Gurion University of the Negev, the Afeka Tel-Aviv Academic College of Engineering, and the Shamoon College of Engineering recently created a system that combines Fourier transform infrared (FT-IR) spectroscopy with machine learning algorithms to identify bacteria that is resistant to antibiotics.

Here are the top five articles that the editors of Spectroscopy published this week.

In a recent study from Cairo University, researchers examined fixed-dose combination drug formulations using chemometrics and artificial neuron networks (ANNs).

Spectroscopy spoke with the CEO and CCO of the instrument manufacturer PerkinElmer to discuss trends in the analytical and life sciences industry.

Peter M. Carlson will take over as CEO of Spectral AI, replacing Wensheng Fan.

Juergen Popp of the Leibniz Institute of Photonic Technology presented at Pittcon 2024 about how artificial intelligence (AI) can help scientists with tumor removal processes.

Nano-X received clearance from the U.S. Food and Drug Administration for its HealthFLD artificial intelligence (AI) software, which is designed to perform automated qualitative and quantitative analysis of liver attenuation from CT scans.
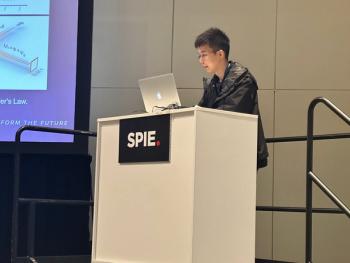
At SPIE Photonics West 2024, Jiachi Ye of the University of Florida held a presentation about a 4f-based free-space optical system (light-based computer) to address power consumption and speed limitations of calculations performed with convolutional neural networks (CNNs).
At SPIE Photonics West, Spectroscopy spoke with Ana Doblas of the University of Massachusetts, Dartmouth about artificial intelligence, deep learning, and their potential in microscopy.
Ana Doblas of the University of Massachusetts Dartmouth presented her team’s findings on how models based on deep learning (DL) can enhance different microscopy imaging infrastructures.
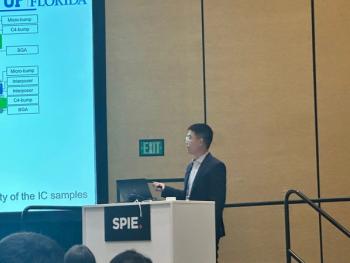
Chengjie Xi of the University of Florida held a lecture on how terahertz time-domain spectroscopy (THz-TDS) can be used to detect changes in integrated-circuit (IC) packaging materials.

In this column and its successor, we describe and explain some algorithms and data transforms beyond those commonly used. We present and discuss algorithms that are rarely, if ever, used in practice, despite having been described in the literature. These comprise algorithms used in conjunction with continuous spectra, as well as those used with discrete spectra.