Spectroscopy
Part III of this series discusses the principle of least squares

Howard Mark serves on the Editorial Advisory Board of Spectroscopy and runs a consulting service, Mark Electronics that provides assistance, training, and consultation in near-IR spectroscopy as well as custom hardware and software design and development.
Spectroscopy
Part III of this series discusses the principle of least squares
Spectroscopy
This column addresses the issue of degrees of freedom (df) for regression models. The use of smaller degrees of freedom (df) (e.g., n or n-1) underestimates the size of the standard error; and possibly the larger df (e.g., n-k-1) overestimates the size of the standard deviation. It seems one should use the same df for both SEE and SECV, but what is a clear statistical explanation for selecting the appropriate df? It is a good time to raise this question once again and it seems there is some confusion among experts about the use of df for the various calibration and prediction situations - the standard error parameters should be comparable and are related to the total independent samples, data channels containing information (i.e., wavelengths or wavenumbers), and number of factors or terms in the regression. By convention everyone could just choose a definition but is there a more correct one that should be verified and discussed for each case? The problem with this subject is in computing the standard deviation using different df without a more rigorous explanation and then putting an over emphasis on the actual number derived for SEE and SECV, rather than on using properly computed confidence intervals. Note that confidence limit computations for standard error have been discussed previously and are routinely derived in standard statistical texts (4).
Spectroscopy
Our annual review of products introduced at Pittcon or during the previous year, broken down by the following categories: accessories, atomic spectroscopy, components, imaging, mass spectrometry, mid-IR, NIR, NMR, Raman, software, UV-vis, and X-ray.

Spectroscopy
This column is the continuation of our discussion in part I dealing with statistics.
Spectroscopy
We present the first of a short set of columns dealing with the subject of statistics. This current series is organized as a “top down” view of the subject, as opposed to the usual literature (and our own previous) approach of giving “bottom up” description of the multitude of equations that are encountered. We hope this different approach will succeed in giving our readers a more coherent view of the subject, as well as persuading them to undertake further study of the field.
Spectroscopy
The archnemesis of calibration modeling and the routine use of multivariate models for quantitative analysis in spectroscopy is the confounded bias or slope adjustments that must be continually implemented to maintain calibration prediction accuracy over time. A perfectly developed calibration model that predicted well on day one suddenly has to be bias adjusted on a regular basis to pass a simple bias test when predicted values are compared to reference values at a later date. Why does this problem continue to plague researchers and users of chemometrics and spectroscopy?
Spectroscopy
When using any regression technique, either linear or nonlinear, there is a rational process that allows the researcher to select the best model.
Spectroscopy
Every year, we prepare this review of new spectroscopy products to make it easy for you to stay up to date on the latest instrumentation, accessories, components, and software. Traditionally, we have referred to this article as the "Pittcon" review.
Spectroscopy
What is it that we thought we knew that we have learned "ain't so" from the work reported in this series of columns?Volume 30 Number 2Pages 24-33What is it that we thought we knew that we have learned "ain't so" from the work reported in this series of columns?
Spectroscopy
Our annual review of products introduced at Pittcon.
Spectroscopy
Additional information from the X-ray section of the Pittcon Review article.
Spectroscopy
Additional information from the fluorescence section of the Pittcon Review article.
Spectroscopy
Additional information from the terahertz section of the Pittcon Review article.
Spectroscopy
Additional information from the atomic spectroscopy section of the Pittcon Review article.
Spectroscopy
Additional information from the Mid-IR (FT-IR) section of the Pittcon Review article.
Spectroscopy
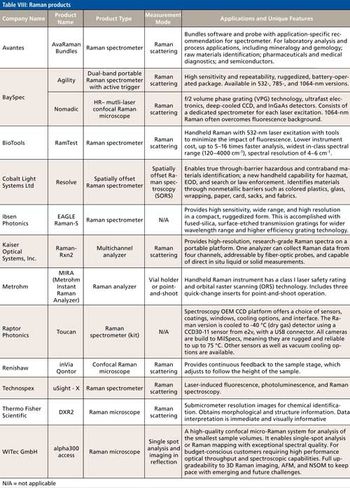
Additional information from the Raman section of the Pittcon Review article.
Spectroscopy
Additional information from the NMR section of the Pittcon Review article.
Spectroscopy
Additional information from the mass spectrometry section of the Pittcon Review article.
Spectroscopy
Additional information from the software section of the Pittcon Review article.
Spectroscopy
Additional information from the components section of the Pittcon Review article.
Spectroscopy
Additional information from the UV-visible section of the Pittcon Review article.
Spectroscopy
Additional information from the accessories section of the Pittcon Review article.
Spectroscopy
Additional information from the NIR section of the Pittcon Review article.
Spectroscopy
Additional information from the imaging section of the Pittcon Review article.

Spectroscopy
As usual, there was concern at the 63rd Pittsburgh Conference on Analytical Chemistry and Applied Spectroscopy (Pittcon 2012) about how well the conference is doing.
Spectroscopy
Our yearly review of the hottest products at Pittcon
Spectroscopy
Columnists Howard Mark and Jerome Workman, Jr. take a final look at the topic of principal components, which has been the subject of six previous installments.

Spectroscopy
Spectroscopy columnist Howard Mark takes a comprehensive look at the products that were introduced at Pittcon 2009 in Chicago.
Spectroscopy
September 2006. In the first part of this two-part series, columnists Jerome Workman, Jr. and Howard Mark discuss the limitations of analytical accuracy and uncertainty.