


Raman Spectroscopy
Latest News
Advertisement
Latest Videos


Advertisement
More News

At the Pittcon Conference and Expo in Saan Antonio, Texas, on Monday, March 9, 2026 (8:30–11:00 AM, Room 304C), the session “Spectroscopy and Sustainability: A Perfect Match” explored how modern spectroscopic technologies are helping laboratories and industries operate more efficiently while reducing environmental impact. Chaired by John Wasylyk and sponsored by the Society for Applied Spectroscopy, the session brought together 6 presentations covering applications from pharmaceutical process monitoring and biomedical diagnostics to chemical manufacturing, defense, and remote sensing. Throughout the morning, a consistent theme emerged: spectroscopy’s speed, nondestructive nature, and rich chemical information make it inherently aligned with the goals of sustainability.

Webcasts
Webinar Date/Time: Wednesday, March 25th, 2025 Morning Session: 10am EDT | 7am PDT | 2pm GMT | 3pm CET Afternoon Session: 1pm EST | 10am PST | 5pm BST | 6pm CET

In this overview, we explore how spectroscopy is advancing the agriculture industry.

A continuation of our recap of a recent study published in Microchemical Journal highlights the implications of how Raman spectroscopy can help analyze ancient DNA remains.

A recent study shows that non-destructive Raman spectroscopy measurements of protein-to-mineral ratios in ancient teeth can accurately predict endogenous DNA preservation, enabling archaeologists to pre-screen specimens and avoid unnecessary destructive sampling.

The Top 10 Most Influential Applications of Vibrational Spectroscopy in Environmental Analysis (2024-2026)
Published: | Updated:
Between 2024 and 2026, environmental applications of vibrational spectroscopy advanced rapidly through innovations in multimodal instrumentation (combining 2 or more distinct measurement techniques), spectral data fusion, portable sensing technologies, and the integration of chemometrics and machine learning (ML). Near-infrared (NIR), Fourier transform infrared (FTIR), and Raman spectroscopy were increasingly deployed to address pressing environmental challenges such as microplastics contamination, soil organic matter quantification, indoor air quality monitoring, and pesticide residue detection in food and ecological systems. This article reviews 10 influential peer-reviewed papers published during this period, providing expanded narrative discussions of their technical contributions and explaining why each paper represents a significant impact on the field.

Artificial intelligence and machine learning are rapidly reshaping how analytical data are modeled, interpreted, and deployed, but the conceptual foundation is already familiar to practitioners of chemometrics. Latent variables, calibration models, variance–bias tradeoffs, and multivariate optimization did not originate with neural networks; they have been central to spectroscopic data analysis for decades. This expanded glossary provides a rigorous, side-by-side translation between modern artificial intelligence (AI) terminology and established chemometric concepts. This glossary is intended to demystify AI terminology, while preserving statistical clarity. It is designed to help analytical scientists, spectroscopists, and chemometricians engage with modern data-driven methods without abandoning physical interpretability or statistical discipline.

In this tutorial, we break down these vibrational spectroscopy advancements and what we can expect in the months and years ahead.

From a chemometric standpoint, artificial intelligence (AI) in spectroscopy is best understood as an extension of established multivariate methods rather than as a replacement. Most AI approaches closely parallel familiar tools such as regression, classification, and principal component analysis, but offer greater flexibility to handle nonlinear behavior, interacting physical and chemical effects, and large, heterogeneous datasets. By learning directly from raw spectra, AI methods can reduce reliance on manual preprocessing while still indicating which spectral regions influence predictions. In this sense, AI represents a developmental layer of chemometrics that enables classical concepts to operate effectively in modern spectroscopic systems. Overall, AI is best viewed as the next developmental layer of chemometrics, not as a competing discipline. As with all current AI programs, domain knowledge of analytical chemistry is essential for AI’s effective application. Knowing the boundaries of what is plausible in any chemical or modeling system allows fine-tuning of the models towards useful and reliable analytical results.
At Pittcon, generative artificial intelligence will be presented at the James L Waters Symposium on Monday, March 9, 2:30 PM to 4:40 PM in Room 221A. Generative artificial intelligence has transitioned from a conceptual novelty to a practical approach for innovation in spectroscopic data analysis. During 2025, a small set of highly influential publications crystallized this transformation by demonstrating how generative models can synthesize realistic spectra, solve inverse spectral problems, accelerate materials discovery, and automate molecular structural elucidation. This article reviews six pivotal contributions published in 2025 that collectively define the state of generative artificial intelligence in spectroscopy. These works establish theoretical foundations, survey emerging methods, introduce physics-informed generative architectures, and demonstrate transformative applications across vibrational, electronic, and magnetic resonance spectroscopies.
Between 2023 and 2026, Raman spectroscopy transitioned from a supportive analytical technique to a central enabling technology in biopharmaceutical analysis and manufacturing. Advances in artificial intelligence (AI), machine learning (ML), automation, and surface-enhanced Raman spectroscopy (SERS) have expanded Raman’s role from nutrient monitoring to real-time prediction of critical quality attributes (CQAs), inline control of complex bioprocesses, and non-destructive analysis of finished drug products. This article reviews ten of the most influential publications from this period, highlighting how they collectively reshaped expectations for Raman spectroscopy as a process analytical technology (PAT) and a quality-by-design (QbD) tool in modern biopharmaceutical development.
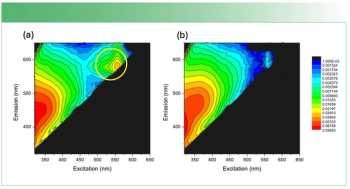
This column will show Raman results and ATEEM fluorescence whose correlations indicate that important information is available non-destructively.
In the past few years, Raman spectroscopy and its technological modifications—such as surface-enhanced Raman spectroscopy (SERS), coherent Raman scattering (CRS), and multimodal platforms—have transitioned from proof-of-concept demonstrations to impactful tools in biomedical research. These advances span therapeutic monitoring, chemical biology imaging, deep-tissue diagnostics, precision oncology, and multimodal analytics. This article synthesizes the most influential reviews in these areas, highlighting emerging trends, limitations, and future directions.

For Pittcon 2026, the James L. Waters Symposium, scheduled for Monday, March 9, from 2:30 to 4:40 p.m. in Room 221A, turns its focus on Generative artificial intelligence (AI) systems in analytical chemistry, which are increasingly being used for analytical data interpretation, algorithm development, experimental planning, and scientific communication. This article introduces the general concepts of generative AI and its use in spectroscopy.

In the lead-up to the American Academy of Forensic Sciences (AAFS) Conference, we reflect on some of the most pertinent ongoing trends in forensic analysis.

The 2026 James L. Waters Annual Symposium at Pittcon will focus on the integration of generative AI into analytical chemistry, examining how large language models and AI tools can support method development, data analysis, and chemical measurement while maintaining scientific rigor, validation, and interpretability. Continuing its decades-long tradition of connecting historical perspective with emerging technologies, the symposium will feature presentations from leading chemists and spectroscopists, highlighting both the opportunities and challenges of responsibly incorporating AI into chemical measurement science.

Pittcon 2026 will take place March 9–11, 2026, in San Antonio, Texas, building on the 2025 conference’s emphasis on eco-friendly practices and serving as the premier global event in analytical research, scientific instrumentation, and applied spectroscopy. An opening plenary session, “Spectroscopy and Sustainability: A Perfect Match,” will highlight how advances in spectroscopic technologies—from biomedical and pharmaceutical applications to UAV-based hyperspectral imaging, CBRNE detection, hazardous materials monitoring, and even extraterrestrial studies—are driving sustainable solutions across diverse fields.

Artificial intelligence is transforming vibrational spectroscopy by automating calibration, feature extraction, and interpretation across Raman, infrared, near-infrared (NIR), and hyperspectral imaging (HSI) systems. This review of articles highlighted in Spectroscopy during 2025 captures several major developments, spanning data fusion, spectral imaging, and industrial and biomedical applications.

A study published in the Journal of Raman Spectroscopy reports the detection of polyethylene, PET, and nylon microplastics in Greece’s remote Dragon Lake on Mt. Tymfi.
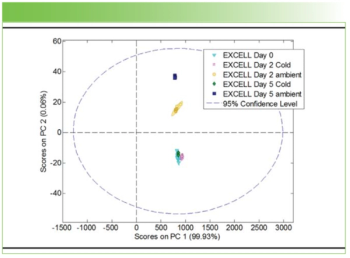
In this "Molecular Spectroscopy Workbench" column, a new spectroscopy, called A-TEEM, is explored.

In 2025, the vibrational-spectroscopy community saw a convergence of deep learning, advanced simulation, and portable instrumentation that materially changed how spectra are interpreted and applied.

In this edition of “Inside the Laboratory,” Maryam Shakiba and Santiago Marin of the University of Colorado Boulder discuss the findings of their latest paper, which provides a predictive framework for understanding and forecasting long-term thermo-oxidative degradation in polyimides.

Researchers at Beijing University of Chemical Technology have developed a rapid online Raman spectroscopy method that accelerates real-time detection and strain screening of the bio-aviation fuel precursor β-farnesene.

Vibrational spectroscopy is undergoing a major transformation driven by advances in new AI and machine learning, portable instrumentation, nanofabrication, hyperspectral imaging, and robust chemometrics. These developments are enabling more sensitive measurements, field-deployable analysis, multimodal data fusion, and automated spectral interpretation suitable for real-world industrial and clinical use. As these technologies converge, the field is positioned for a renaissance that may redefine how spectroscopy is practiced by 2030.
This review article highlights how a new review by Da-Wen Sun demonstrates that integrating spectroscopy with chemometric techniques can significantly improve cold chain food quality monitoring, authentication, and overall system efficiency.
Advertisement
Advertisement
Trending on Spectroscopy Online
1
X-Ray Spectroscopy Analysis: Techniques and Applications Across Science and Industry
2
Reading the Heat of the Giza Pyramids with Infrared Thermography
3
Submicron IR Detects and Localizes Microplastics in Biological Samples
4
Educating Students on Spectroscopy
5