
Special Issues
Many organic chemicals are difficult to analyze using traditional GC–MS. In this study, the author used LC–MS-MS to analyze a variety of environmental contaminants.
Special Issues
Many organic chemicals are difficult to analyze using traditional GC–MS. In this study, the author used LC–MS-MS to analyze a variety of environmental contaminants.
Special Issues
Here, the authors demonstrate the use of a systematized approach to SPE method development and LC–MS-MS analysis.

Spectroscopy
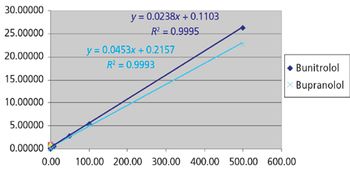
In the fourth part of a five-part series, columnist Ken Busch discusses factors that might cause deviation from linearity at the upper and lower limits of a calibration curve.
Special Issues
The in-tube extraction technique for determination of volatile organic compounds in water is described.
Special Issues
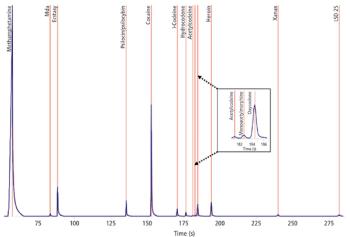
This article presents GC–TOFMS methods developed to identify several major drug classes and chemical functionalities.
Spectroscopy
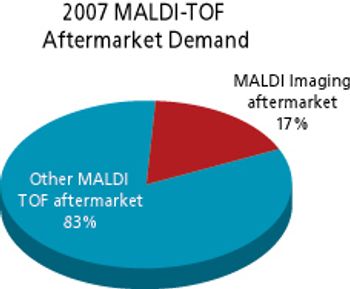
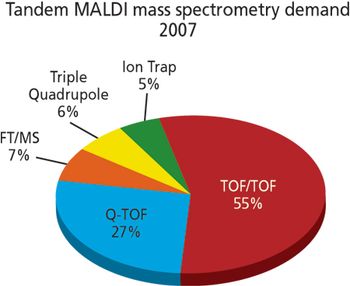
The adoption of MALDI-TOF mass spectrometry for imaging applications is a major recent development in the market. Applications lie squarely in the life sciences area, being primarily in histopathology. The market for MALDI imaging products already accounts for a significant and rapidly growing portion of the aftermarket for MALDI-TOF mass spectrometry.
Spectroscopy
First developed in the mid-1980s, matrix assisted laser desorption ionization (MALDI) added a complementary mass spectrometry ionization technique to others that were already on the market, such as electrospray ionization (ESI).
Spectroscopy
Columnist Ken Busch presents the third of a five-part series on quantitative mass spectrometry. In this installment, he focuses on an overview of regression analysis for calibration lines and curves in mass spectrometry.
Spectroscopy
The concept of portable mass spectrometry has been around for some time, but the realization of such technology has been largely limited until very recently. More than ever before, recent technological advances now make smaller, lighter, and more effective mass spectrometers possible. Such advances will lend themselves to a growing spectrum of applications as well.
Spectroscopy
In this month's installment, columnist Ken Busch continues his discussion of quantitative mass spectrometry with a look at the "cancel out" claim and some of the statistical underpinnings for the proportional comparison of instrument responses for standard knowns and unknowns.

Spectroscopy
This tutorial illustrates the most important definitions used in high-resolution mass spectrometry and clarifies the misconceptions surrounding some of the relevant terms used in this field.

Special Issues
In this article, the role of a triple-quadrupole mass spectrometer in performing in vitro studies of compound metabolic stability and identification of Phase I and II metabolites is demonstrated.

Special Issues
The list of acronyms in mass spectrometry published regularly here reflects the writings and conversations of mass spectrometrists, who use a variety of acronyms to describe particular experiments or applications. New applications, with new audiences, bring new technical jargon.

Spectroscopy
In addition to expressing his longing for a Star Trek "tricoder," columnist Ken Busch shows that the core processes of ionization, ion dissociation, and mass determination in mass spectrometry are all completed in very short times compared to the overall length of the analysis.

Spectroscopy
This month's "Focus on Quality" presents a critique of the GAMP Good Practice Guide. And while columnist Bob McDowall finds much to recommend in the guide, he finds much more cause for concern.

Spectroscopy
Here the author compares near-infrared to mid-infrared as analytical tool in process management. he weighs the pros and cons of both spectral regions and suggests general applications for which one or the other is better suited.

Spectroscopy
Realistically, 2005 was a good year for the laboratory analytical and life science instrument industry. Although growth has moderated from that experienced in the 1990s, a general rebound in worldwide industrial demand, and continued spending for life science and strong growth in Asia and North America drove instrument systems and aftermarket sales. Similar to last year, 2006 should be a year of healthy sales growth as global economic conditions support continued market expansion.