

SPEC PerkinElmer 10.13

Data Analytics, Statistics, Chemometrics, and Artificial Intelligence

Latest News


Spectroscopy

This column is the continuation of a series (1-5) dealing with the rigorous derivation of the expressions relating the effect of instrument (and other) noise to its effects on the spectra we observe. Our first column in this series was an overview. While subsequent columns dealt with other types of noise sources, the ones listed analyzed the effect of noise on spectra when the noise is constant detector noise (that is, noise that is independent of the strength of the optical signal). Inasmuch as we are dealing with a continuous series of columns, on this branch in the thread of the discussion, we again continue the equation numbering and use of symbols as though there were no break. The immediately previous column (5) was the first part of this set of updates of the original columns.

Spectroscopy

This tutorial reviews the mathematical models for dealing with interelement effects in optical emission and X-ray fluorescence spectrochemical analysis. Line overlaps and matrix effect corrections are examined.

Spectroscopy

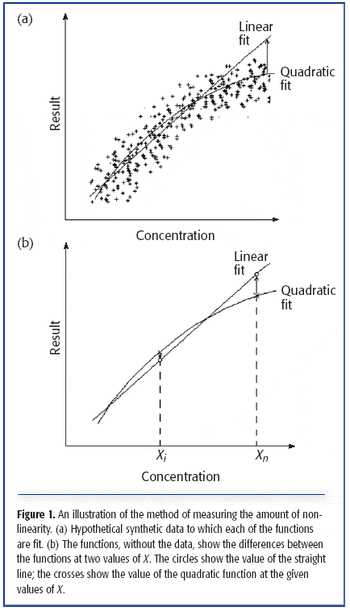
At this point in our series dealing with linearity, we have determined that the data under investigation do indeed show a statistically significant amount of nonlinearity, and we have developed a way of characterizing that nonlinearity. Our task now is to come up with a way to quantify the amount of nonlinearity, independent of the scale of either variable, and even independent of the data itself.

Spectroscopy

At this point in our series dealing with linearity, we have determined that the data under investigation do indeed show a statistically significant amount of nonlinearity, and we have developed a way of characterizing that nonlinearity. Our task now is to come up with a way to quantify the amount of nonlinearity, independent of the scale of either variable, and even independent of the data itself.